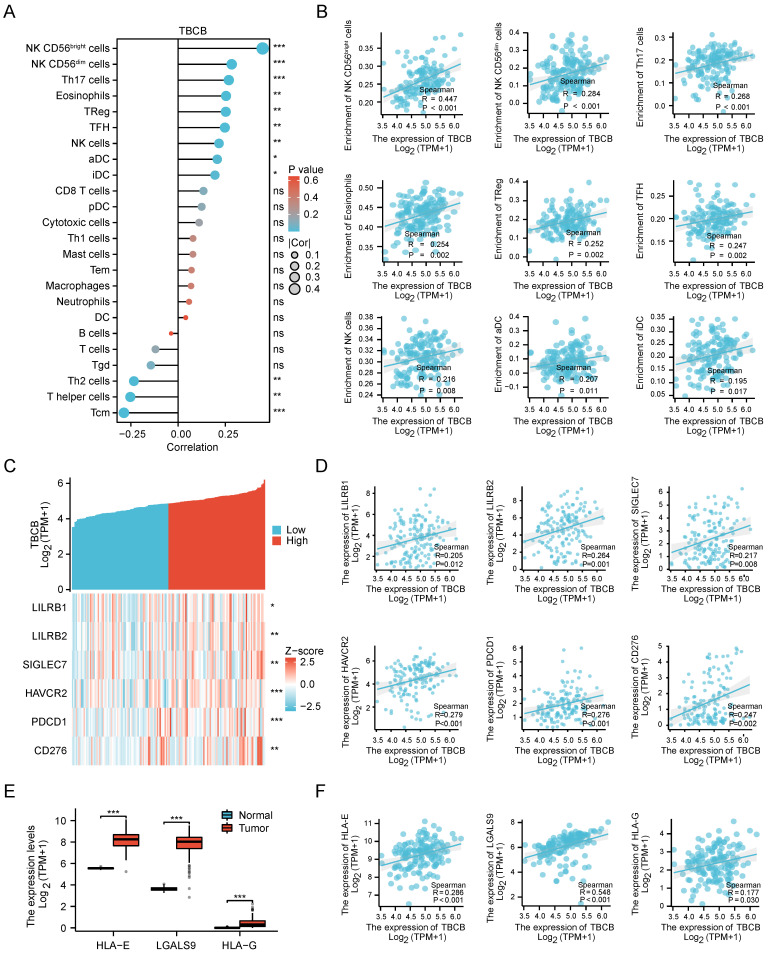
Figure 5.
Correlationships between TBCB expression level and infiltrating immune cells, immune checkpoint in AML. (A) The relationship between the mRNA level of TBCB and twenty four infiltrating immune cells were examined by Spearman's correlation. (B) Correlation scatter plots for nine immune infiltrating cells positively linked to TBCB transcription level. (C-D) Co-expression heat map (C) and correlation scatter plots (D) of TBCB gene with six momentous immune checkpoint molecules in AML. (E) Expression levels of ligands for inhibitory NK cell receptors (HLA-E, HLA-G and LGALS9) in AML. Data was originated from TCGA-LAML and GTEx database. (F) Correlation scatter plots of TBCB gene with three ligands for inhibitory NK cell receptors in AML. *p < 0.05, **p < 0.01, ***p < 0.001.

