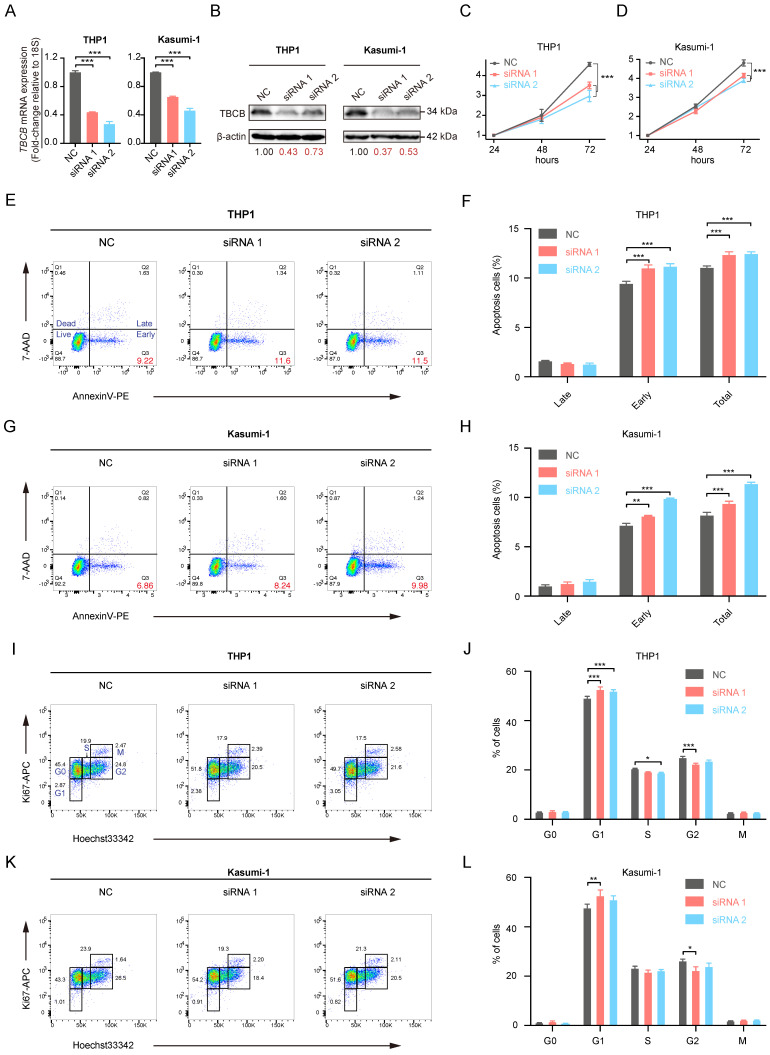
Figure 7.
The effects of TBCB knockdown on cell proliferation in AML human cell lines. (A) RT-qPCR analysis for transcriptional levels of TBCB in AML cell line THP1 (left) and Kasumi-1 (right) transduced with NC-siRNA or siTBCB oligonucleotides. Expression levels are normalized to 18S. (B) Western blotting for TBCB expression in THP1 (left) and Kasumi-1 (right) cell lines transduced with NC-siRNA or siTBCB oligonucleotides. (C-D) Proliferation curves of control and siTBCB groups in THP1 (C) and Kasumi-1 (D) cell lines were measured by CCK8. (E-H) The apoptosis analysis of AML cell lines transfected with siTBCB and NC-siRNA. Representative flow cytometry plots of apoptotic ratio in THP1 (E) and Kasumi-1 (G) cell lines. Statistical analysis of apoptotic ratio in THP1 (F) and Kasumi-1 (H) cell lines. (I-L) The cell cycle analysis of AML cell lines transfected with siTBCB and NC-siRNA. Representative flow cytometric analysis of cell cycle in THP1 (I) and Kasumi-1 (K) cell lines. Quantification of G0, G1, S, G2 and M phases in THP1 (J) and Kasumi-1 (L) cell lines. All statistical values were presented as the means ± SEM. n = 3, *p < 0.05, **p < 0.01, ***p < 0.001, by one-way ANOVA.

