Figure 1.
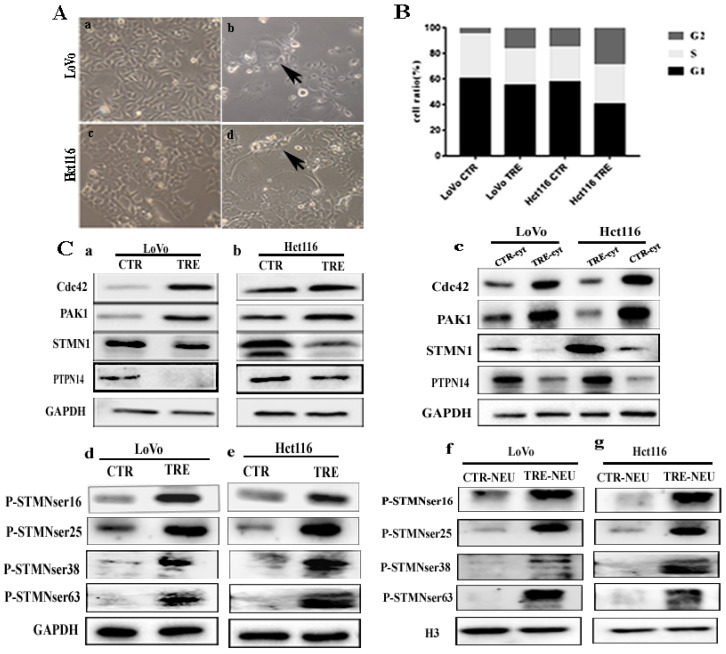
A. Formation of PGCCs after CoCl2 treatment in LoVo and Hct116 colorectal cancer cell lines (200×). (a) LoVo control cells, (b) CoCl2-treated LoVo cells (black arrow indicates PGCCs), (c) Hct116 control cells, and (d) CoCl2-treated Hct116 cells, black arrow points to PGCCs. B. Columnar percentage plot showing the ratio of cells at G1, S, and G2 stages of cell cycle in LoVo and Hct116 cells before and after CoCl2 treatment. C. (a,b) Western blotting result of Cdc42, PAK1, STMN1, and PTPN14 in LoVo and Hct116 control and CoCl2-treated cells. (c) Cytoplasmic expression of Cdc42, PAK1, STMN1, and PTPN14 in LoVo and Hct116 control and CoCl2-treated cells. (d, e) Expression of four phosphorylation sites of STMN1 in LoVo and Hct116 control and CoCl2-treated cells. (f, g) Nuclear expression of the four phosphorylation sites of STMN1 in LoVo and Hct116 control and CoCl2-treated cells.

