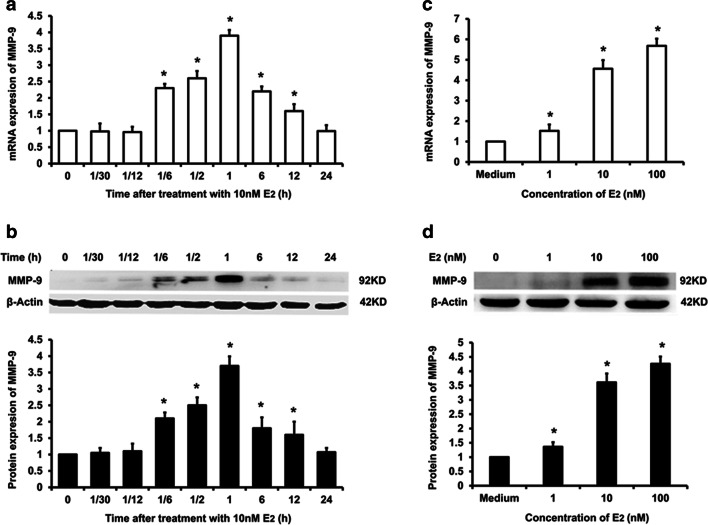
Fig. 1.
E2-induced MMP-9 expression in MCF-7 breast cancer cells. ERα-positive MFC-7 breast cancer cell was treated with 10 nM E2 for different time periods; mRNA (a) and protein expression (b) of MMP-9 were detected respectively by real-time PCR and Western blot. For investigating the concentration-response relation between E2 treatment and expression of MMP-9, MCF-7 was treated with 1~100 nM E2 for 1 h, and mRNA (c) and protein expression (d) of MMP-9 were detected respectively by real-time PCR and Western blot. All presented figures are representative data from at least three independent experiments. *P < 0.05 compared with 0 h of E2 treatment (a, b) or medium control (c, d)

