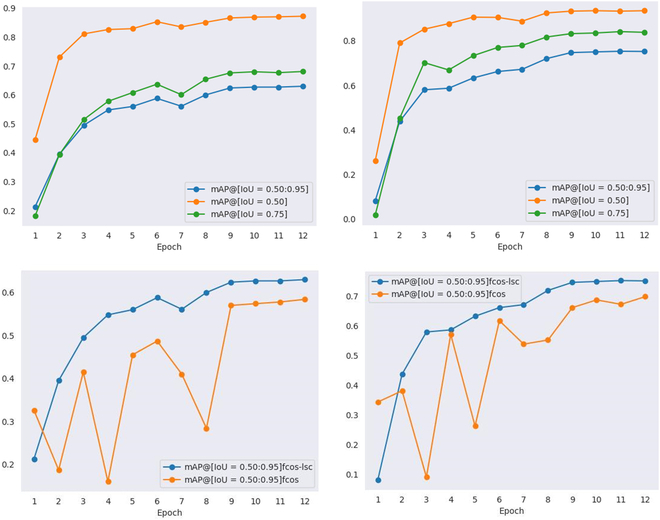
Fig. 8.

AP values under each epoch on the 2 datasets. (Left) Apple validation set. (Right) Persimmon validation set. The top row shows the change curves of AP values of FCOS-LSC on the 2 datasets, and the bottom row shows the change curves of AP values of FCOS-LSC compared with the baseline model on the 2 datasets.
