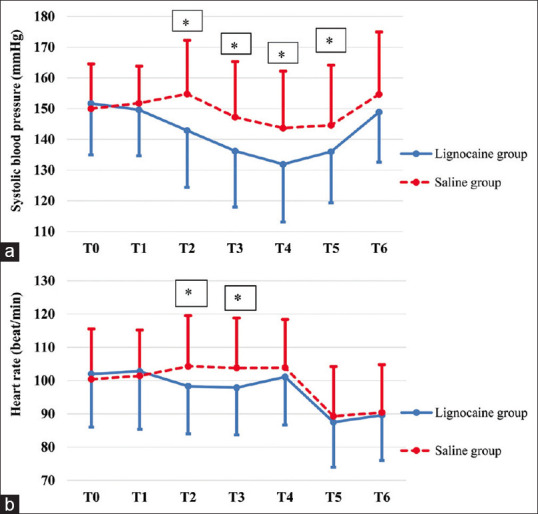
Figure 2.

(a and b): Changes in systolic blood pressure and heart rate. T0: baseline (prior to nebulisation), T1: before induction of anaesthesia, T2: one minute after intubation, T3: three minutes after intubation, T4: five minutes after intubation, T5: after delivery of the foetus, T6: at the end of surgery. Values are presented as mean±SD. *Indicates significant difference between both groups (P<0.05)
