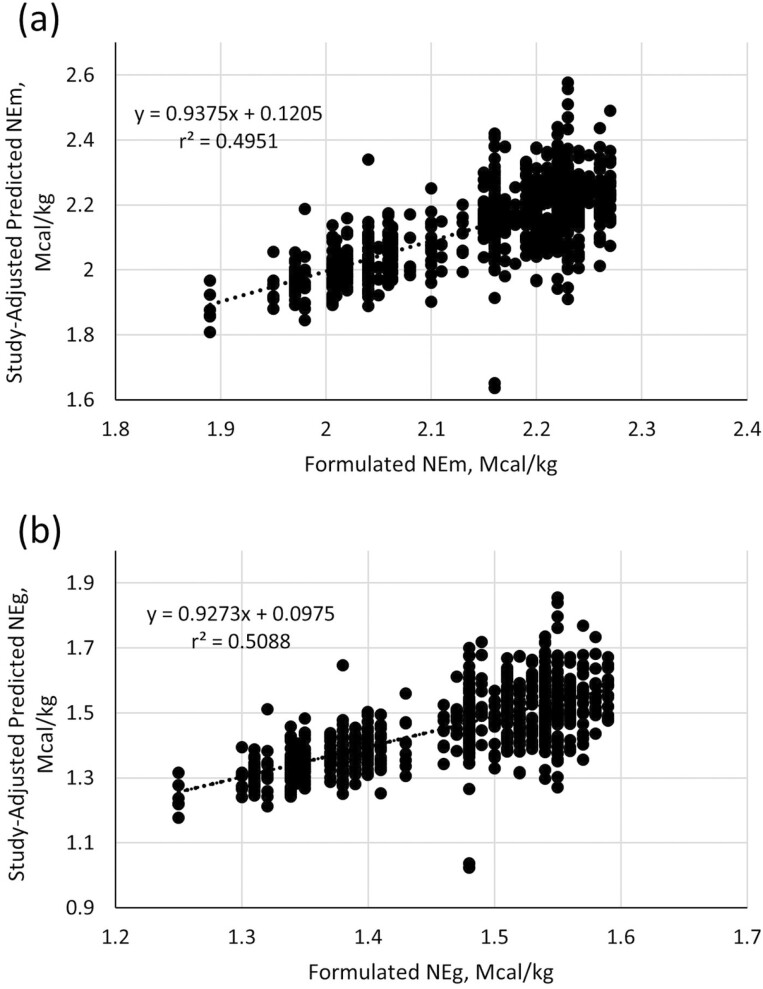
Figure 1.
Study-adjusted NEm (a) and NEg concentrations (b) predicted from growth performance vs. NEm concentration calculated from dietary ingredients using NASEM (2016) tabular values. For predicted NEm concentration, the 95% confidence limits from the mixed-model analyses were −0.357 and 0.598 for the intercept and 0.726 and 1.149 for the slope. Comparable 95% confidence interval limits for predicted NEg were −0.222 and 0.417 for the intercept and 0.720 and 1.134 for the slope.

