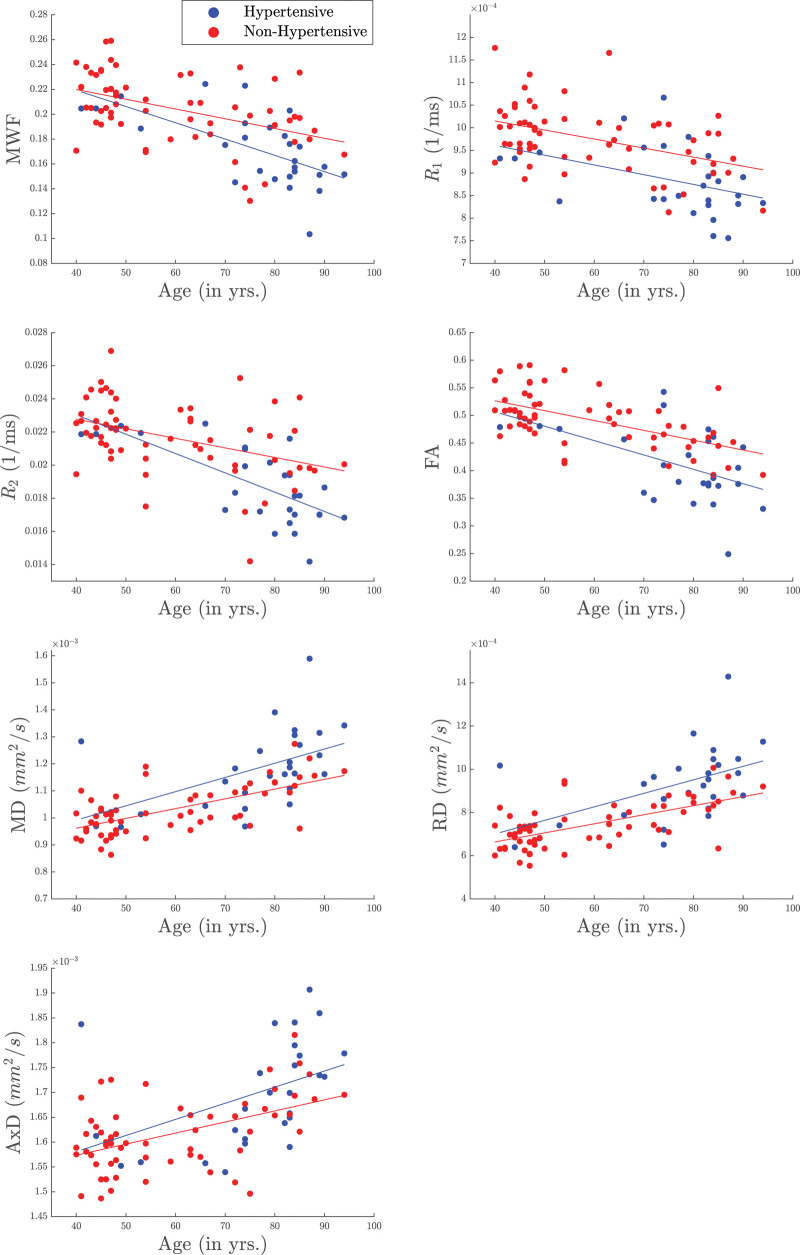
Figure 3.
Examples of scatter plots of myelin water fraction (MWF), R1, R2, fractional anisotropy (FA), medial diffusivity (MD), radial diffusivity (RD), and axial diffusivity (AxD) as a function of age stratified by groups. The hypertensive group is indicated by the blue color while the control group is indicated by the red color. Results were obtained from the corpus callosum ROI for MWF, R1 and R2, while from the temporal lobes ROIs for FA, MD, RD, and AxD. It is readily seen that derived MWF, R1, R2, and FA parameter values decrease with age while the diffusivity values increase with age, as expected. Importantly, the hypertensive patients exhibit lower MWF, R1, R2, and FA parameter values or higher diffusivity values as compared to control. R1 indicates longitudinal relaxation rate; and R2, transverse relaxation rate.

