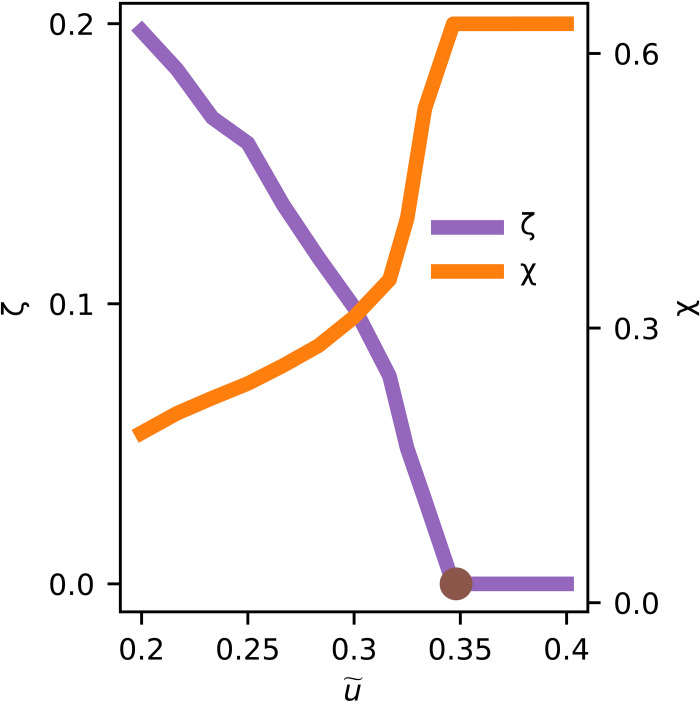
Fig. 3. The zero-temperature phase diagram calculated in the large-N limit.
As the interaction is increased, η gradually decreases and goes to zero at (marked by the brown dot), which signals a continuous orbital-selective Mott transition between a Kondo-driven and Kondo-destroyed phases, with a large and a small Fermi surface, respectively.

