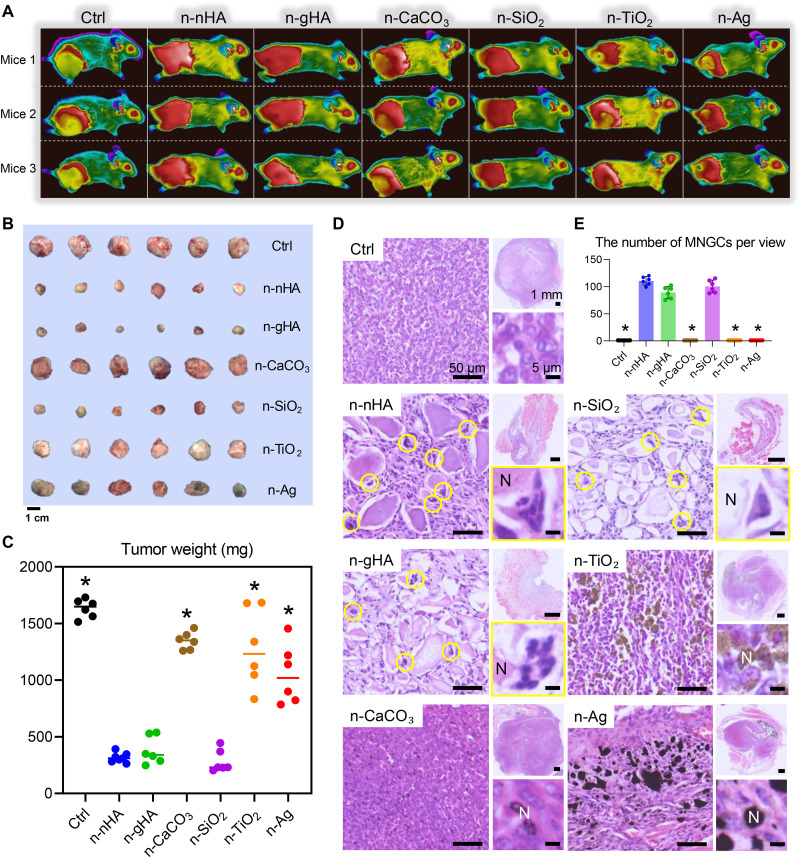
Fig. 1. In vivo antitumor effects of six inorganic nanoparticles.
(A) Thermal images of tumor-bearing mice after a single injection of different inorganic nanoparticles. Three representative mice from each group are shown at day 28. Figure S6A shows mouse thermal images at other time points. Panels B and C of fig. S6 show the measurements of mouse body weight and tumor volumes during the experimental window. (B) Photographs and (C) the measurement of weight of excised tumors at the end of in vivo studies. Scale bar, 1 cm. *P < 0.05, significant difference was assessed by one-way analysis of variance (ANOVA) followed by Tukey’s post hoc test compared to n-nHA, n-gHA, and n-SiO2 groups. (D) Representative hematoxylin and eosin (H&E) staining images of tumor tissues excised at day 28. Top-right images show tumor tissues at low magnification. Scale bars, 1 mm. Left images show the appearance of nanoparticle aggregates in tumors. Scale bars, 50 μm. Bottom-right images show the highly magnified cells surrounding the nanoparticle aggregates. Scale bars, 5 μm. N, aggregates of nanoparticles. Circles indicate the MNGCs. (E) Average number of MNGCs counted from 100-fold histology images of tumors representative of three independent mice. *P < 0.05, significant difference was assessed by one-way ANOVA followed by Tukey’s post hoc test compared to n-nHA, n-gHA, and n-SiO2 groups. Ctrl, control.

