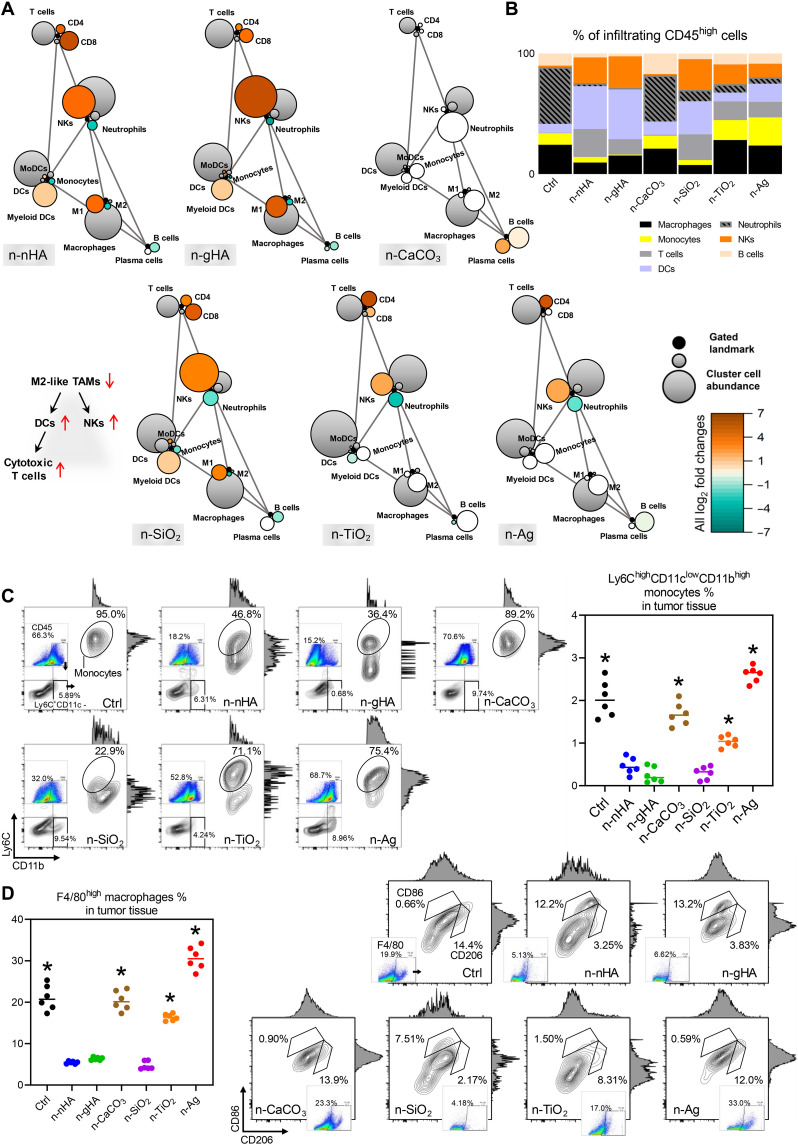
Fig. 2. Remodeled tumor immune landscape evoked by nanoparticles.
(A) Statistical scaffold maps of tumor immune frequencies relative to the negative Ctrl group with no nanoparticle treatment. Nodes in black reflect cell populations distinguished manually, and nodes with other colors denote unsupervised clustering of immunocytes. The size of the node indicates the abundance of the cell subset in the parent immunocyte. The grade of coloring indicates the log2 fold change: Orange color represents significantly higher population frequency. Green color represents significantly lower frequency. White color represents cell frequency with no significant difference compared to the Ctrl group. (B) Composition of immunocyte infiltrations in the TME with manual gating. Representative scatter plots and quantification of (C) Ly6ChighCD11clowCD11bhigh monocytes and (D) F4/80high macrophages in the tumor masses at day 28. *P < 0.05, compared to the n-nHA, n-gHA, and n-SiO2 groups.

