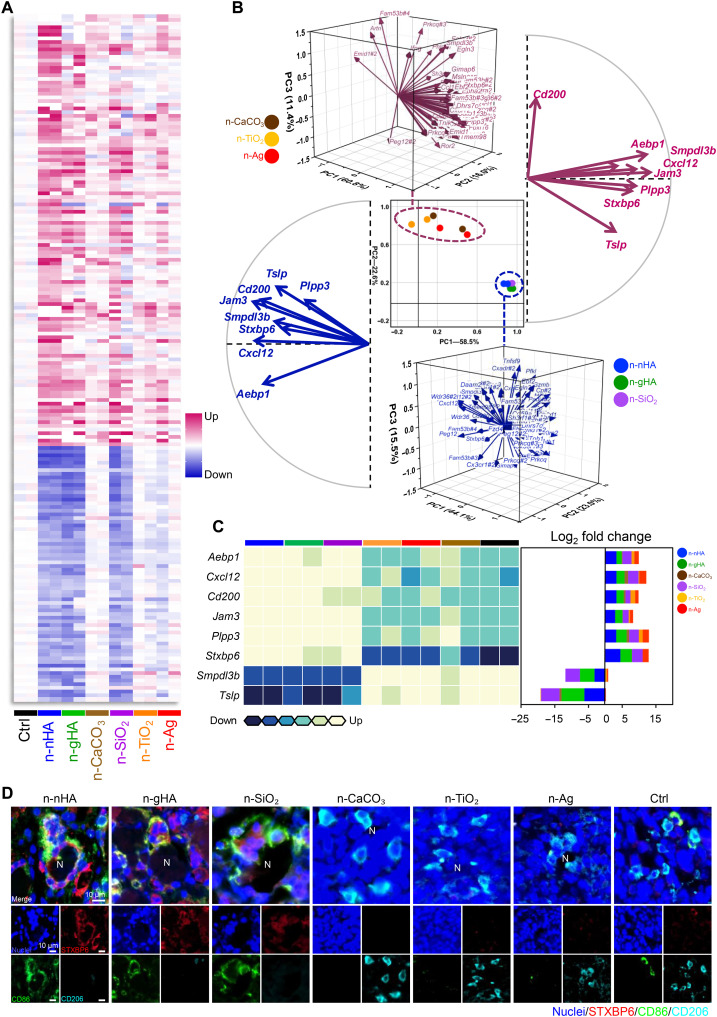
Fig. 3. Transcriptional analysis for screening key genes in the nanoparticle-mediated antitumor immune response.
(A) Heatmap of immune-associated genes differentially expressed in tumors of the n-nHA group compared to the Ctrl group. Tumors were excised at day 28 after nanoparticle treatment. Fold change > 5. P < 0.05. (B) PCA of overlapping genes differentially expressed among the antitumor groups, i.e., the n-nHA, n-gHA, and n-SiO2 groups, compared to the Ctrl group. The scatter plot (center) with principal components (PCs) 1 and 2 shows the variation in gene profiles among mice treated with different nanoparticles. Three-dimensional vector plots in blue and pink show the gene contributions to PCs 1 and 2 of the antitumor groups and other ineffective groups, respectively. Two-dimensional vector plots in blue and pink show the eight genes with reversed contributions between the antitumor and ineffective groups, respectively. (C) Heatmap (left) of the eight genes with reversed contributions between the antitumor and ineffective groups. Row normalized to each gene’s maximum positive expression. Stacked bar plot (right) of the log2 fold change in gene expression relative to the Ctrl, colored by nanoparticles. (D) Representative IF images of tumor tissues treated with different nanoparticles. Tumors were collected at day 28 after nanoparticle treatment. Red, STXBP6; green, CD86; cyan, CD206; blue, nuclei [4′,6-diamidino-2-phenylindole (DAPI)]. Scale bars, 10 μm.

