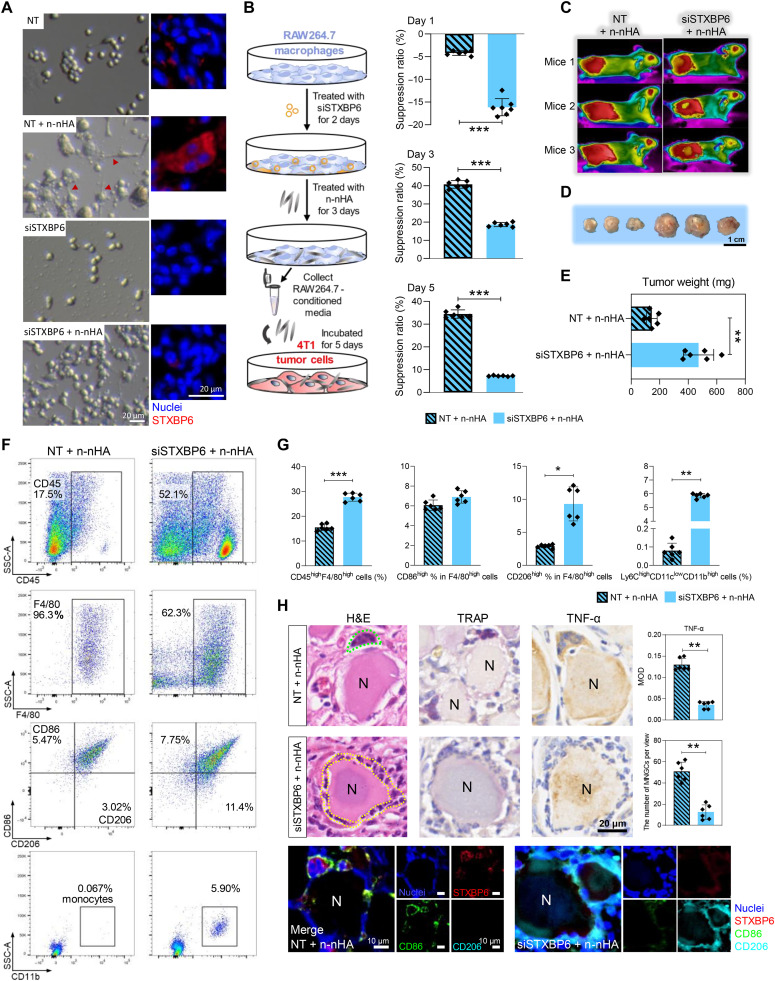
Fig. 4. Stxbp6 knockdown inhibited macrophage fusion to form MNGCs and abolished the antitumor efficacy of n-nHA in vitro and in vivo.
(A) Representative photographs (left) and immunofluorescence (right) of macrophages cultured with no siRNA treatment (NT group), n-nHA but no siRNA treatment (NT + n-nHA group), Stxbp6-silenced treatment (siSTXBP6 group) alone, and n-nHA plus Stxbp6-silenced treatment (siSTXBP6 + n-nHA group). Red, STXBP6; blue, nuclei (DAPI). Scale bars, 20 μm. Figure S22 shows the ratio of cells with fusopods and the quantification of macrophage area and length. (B) Experimental scheme (left) and suppression ratios (right) of tumor cells cultured in MnCM of the NT + n-nHA and siSTXBP6 + n-nHA groups. **P < 0.01 and ***P < 0.001. (C) Thermal images of n-nHA–treated tumor-bearing mice with saline (no siRNA) or siSTXBP6 intratumoral injection twice every 3 days. Three representative mice from each group are shown at day 28. (D) Photographs and (E) the measurement of weight of the excised tumors 28 days after siRNA injection. Scale bar, 1 cm. **P < 0.01. (F) Representative scatter plots and (G) quantification of CD45high lymphocytes, F4/80highCD86high M1-like macrophages, F4/80highCD206high M2-like macrophages, and Ly6ChighCD11clowCD11bhigh monocytes in tumor tissues collected at day 28. *P < 0.05, **P < 0.01, and ***P < 0.001. (H) Representative H&E, IHC, and IF staining images of tumor tissues excised at day 28. The average number of MNGCs counted from 100-fold histology images of tumors representative of three independent mice. IHC staining of TRAP and TNF-α shows the location and cytokine expression of MNGCs. In IF staining, red, STXBP6; green, CD86; cyan, CD206 (cyan); and blue, nuclei (DAPI). Black scale bar, 20 μm. White scale bars, 10 μm. **P < 0.01.

