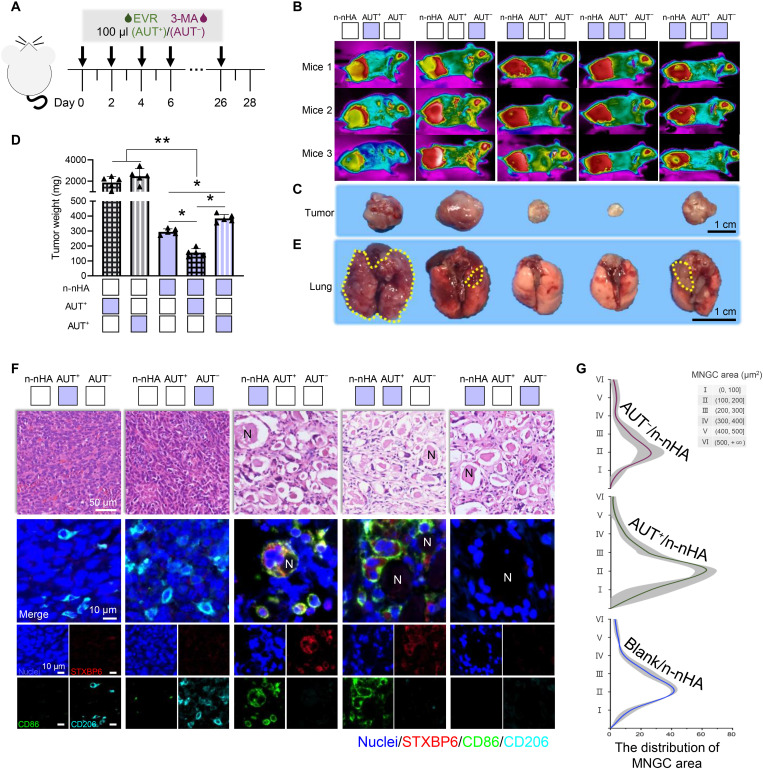
Fig. 5. STXBP6-regulated autophagy drives MNGC generation.
(A) Experimental timeline and treatments of the in vivo study. BALB/c mice were inoculated with 4T1 cells and n-nHA on day 0. The tumor-bearing mice were then intratumorally injected with EVR or 3-MA every other day until day 28. (B) Thermal images of n-nHA–treated tumor-bearing mice with EVR or 3-MA injection for autophagy promotion (AUT+) and inhibition (AUT−), respectively. Tumor-bearing mice treated with EVR or 3-MA alone were used as Ctrl groups. Three representative mice from each group are shown at day 28. (C) Photographs and (D) the measurement of weight of the excised tumors at day 28. Scale bar, 1 cm. *P < 0.05 and **P < 0.01. (E) Representative lung images of different groups. Lung metastases are indicated within yellow dotted lines. Scale bar, 1 cm. Figure S29 shows the corresponding H&E staining images of lung tissues. (F) Representative H&E (top row) and IF staining images (bottom rows) of tumor tissues excised at day 28. Scale bar in H&E staining, 50 μm. In IF staining, red, STXBPT; green, CD86; cyan, CD206; and blue, nuclei (DAPI). Scale bars in IF staining, 10 μm. (G) The distribution of the MNGC area counted from 100-fold histology images of tumors representative of three independent mice. Blank/n-nHA, n-nHA treatment with vehicle phosphate-buffered saline (PBS) injection; AUT+/n-nHA, n-nHA treatment with EVR injection; AUT−/n-nHA, n-nHA treatment with 3-MA injection.

