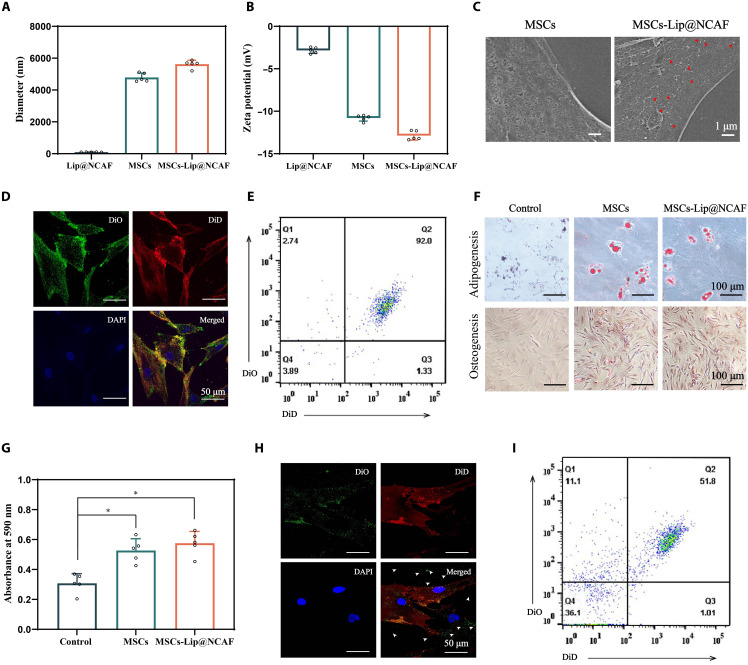
Fig. 3. Preparation and characterization of MSCs-Lip@NCAF.
The size distribution (A) and zeta potential (B) of Lip@NCAF, MSCs, and MSCs-Lip@NCAF (n = 5). (C) Scanning electron microscopy images of MSCs and MSCs-Lip@NCAF. Fluorescence images of DiO-labeled Lip@CAF and DiD-labeled MSCs, as determined by CLSM (D) and FCM (E). (F) Adipogenic and osteogenic differentiation of MSCs and MSCs-Lip@NCAF. (G) The migration of MSCs and MSCs-Lip@NCAF in the presence of CXCL12 (n = 5). Fluorescence images of DiD-labeled MSCs and released DiO-labeled Lip@CAF in the presence of MMP-2, as determined by CLSM (H) and FCM (I). Data are means ± SD. *P < 0.05.

