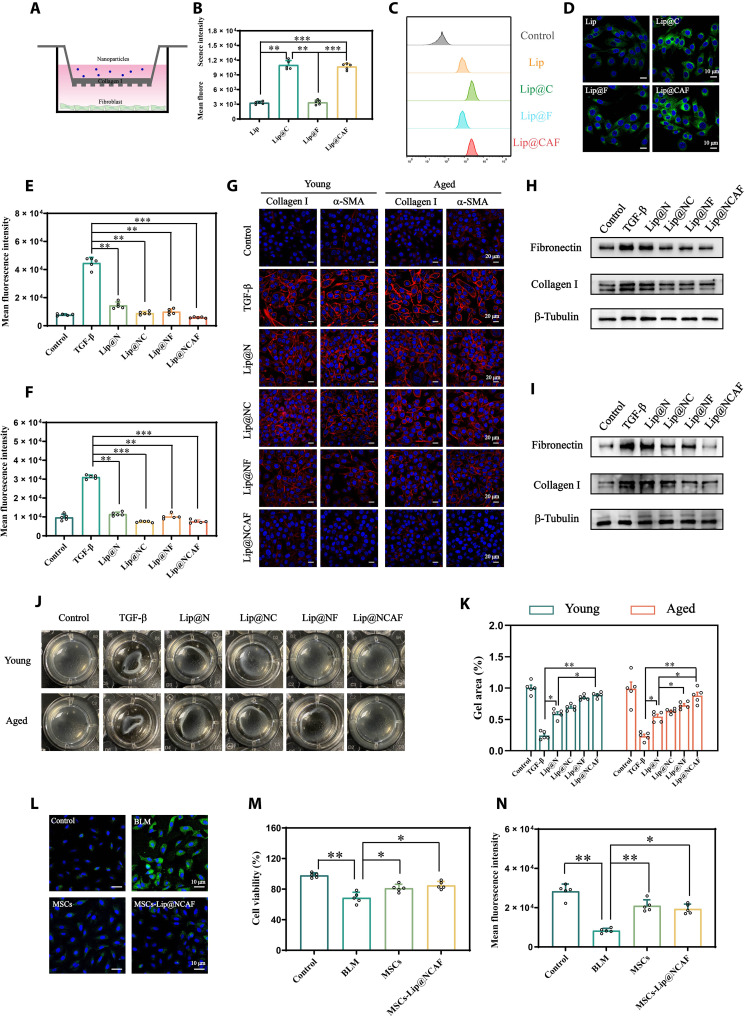
Fig. 4. The antifibrotic effects of MSCs-Lip@NCAF in vitro.
(A) Illustration of the collagen barrier model in vitro. (B and C) The fluorescence intensity of y-fibroblasts was measured by FCM after adding different coumarin 6–labeled formulations to the Transwell chambers (n = 5). (D) Cellular uptake in y-fibroblasts, as shown by CLSM. Inhibition of y-fibroblast (E) and a-fibroblast (F) proliferation by Lip@NCAF, as shown by EdU staining (n = 5). (G) IF analysis of collagen I and α-SMA in y-fibroblasts and a-fibroblasts. WB analysis of fibronectin and collagen I in y-fibroblasts (H) and a-fibroblasts (I). (J) Images of collagen contraction mediated by y-fibroblasts and a-fibroblasts. (K) Quantitative analysis of the gel area in (J) (n = 5). (L) IF analysis of vimentin when A549 cells were incubated with MSCs and MSCs-Lip@NCAF in the presence of BLM. The survival (M) and proliferation (N) of A549 cells after incubation with MSCs and MSCs-Lip@NCAF in the presence of BLM (n = 5). Data are means ± SD. *P < 0.05, **P < 0.01, and ***P < 0.001.

