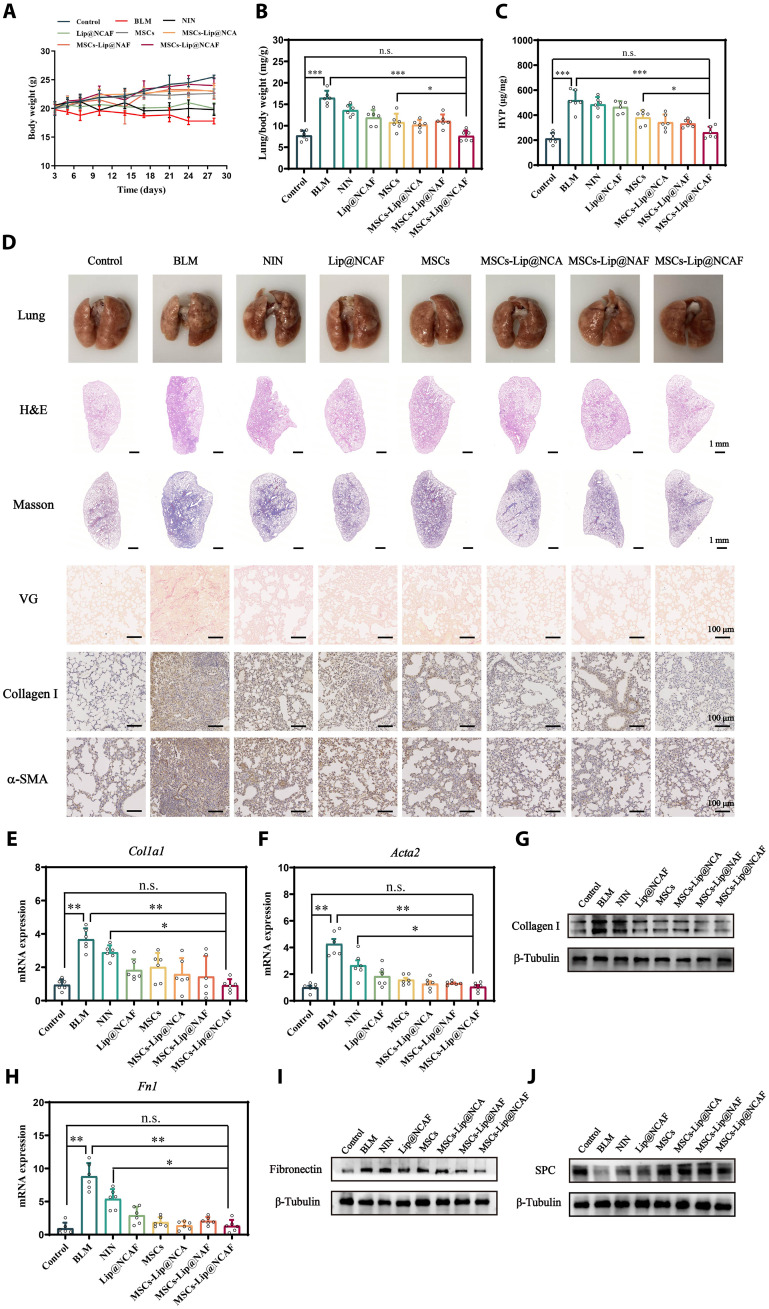
Fig. 6. Antifibrotic effects of MSCs-Lip@NCAF on young mice.
(A) Body weight after treatment with different formulations (n = 6). (B) Lung/body weight in the different groups (n = 6). (C) The levels of HYP (n = 6). (D) Morphology and H&E, Masson, and IHC staining of lung sections. RNA levels of Col1a1 (E) and Acta2 (F) (n = 6). (G) WB analysis of collagen I. qPCR (H) and WB (I) of fibronectin (n = 6). (J) The expression of SPC was analyzed by WB. Data are means ± SD (A) to (C) or means ± SEM (E), (F), and (H). *P < 0.05, **P < 0.01, and ***P < 0.001. n.s., no significant difference.

