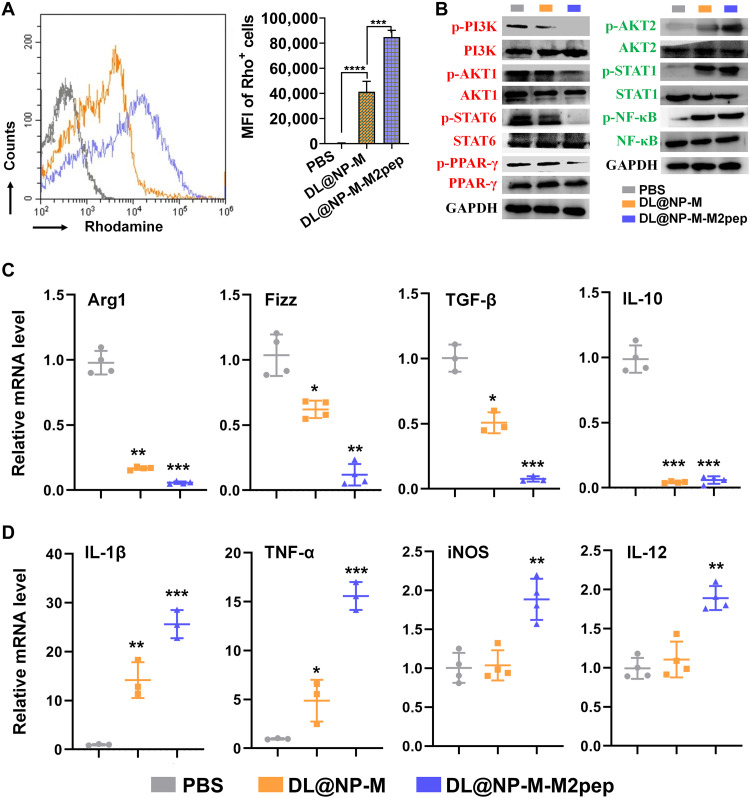
Fig. 5. DL@NP-M-M2pep induces the polarization of M2 macrophages to M1 ones.
(A) Cellular uptake of rhodamine-labeled DL@NP-M and DL@NP-M-M2pep (50 mM DL, same as below) was assessed using flow cytometry (n = 3; ***P < 0.001 and ****P < 0.0001). (B) The activity of PI3K/Akt and NF-κB pathways in M2 macrophages treated with PBS, DL@NP-M, and DL@NP-M-M2pep was analyzed using Western blot assay. The quantification was shown in fig. S5. (C) Quantitative RT-PCR was performed to examine the mRNA expression of M2-associated genes in M2 macrophages treated with PBS, DL@NP-M, and DL@NP-M-M2pep (n = 4; *P < 0.05, **P < 0.01, and ***P < 0.001 to PBS). (D) Quantitative RT-PCR was performed to examine the mRNA expression of M1-associated genes in M2 macrophages treated with PBS, DL@NP-M, and DL@NP-M-M2pep (n = 4; *P < 0.05, **P < 0.01, and ***P < 0.001 to PBS).

