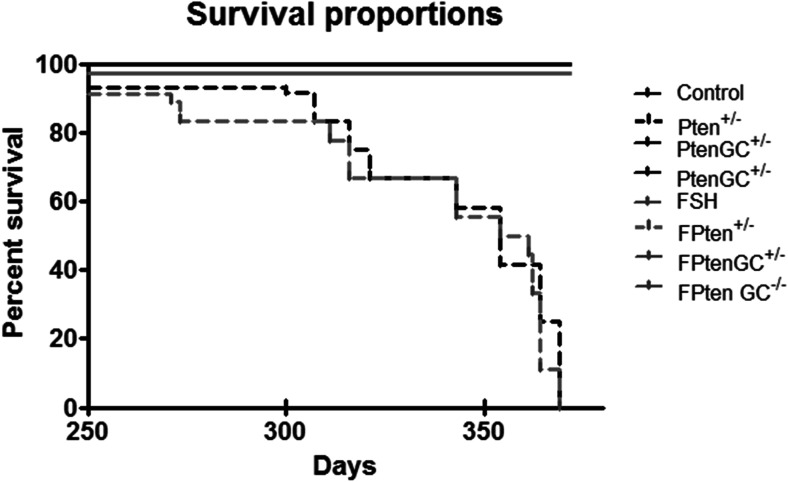
Fig. 4.
Pten +/− ± TgFSH mice had accelerated tumour formation and significantly decreased survival rate when compared to controls (p < 0.05). Black line represents controls, Pten GC+/− and Pten GC−/− and grey line TgFSH, FPten GC+/− and FPten GC−/− mice (N = 7–12 mice per genotype), black broken line represents Pten +/− (N = 31) and grey broken line represents FPten +/− (N = 27)

