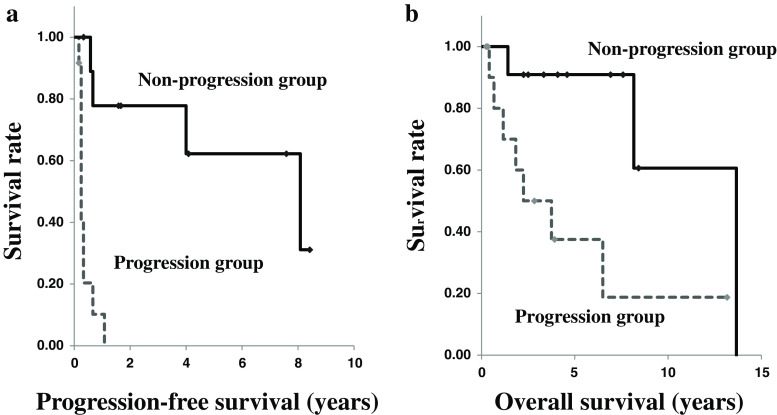
Fig. 1.
Kaplan–Meier survival curves in the non-progression and progression groups. a Progression-free survival (PFS). b Overall survival (OS). The PFS and OS in the non-progression group (solid lines; PFS, 1.7 ± 3.3 years; OS, 4.6 ± 3.6 years) were significantly longer than in the progression group (dashed lines; PFS, 0.3 ± 0.3 years; OS, 2.0 ± 3.7 years), as determined by Kaplan–Meier analysis with the log-rank test (χ 2 = 16.81; p < 0.001, and χ 2 = 6.16; p = 0.01, respectively)

