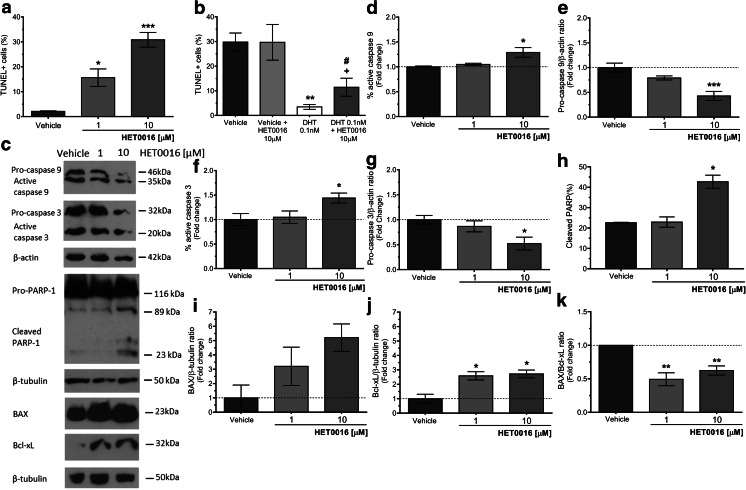
Fig. 6.
Effect of HET0016 on the apoptosis of LNCaP cells. Cells were grown for 5 days in complete media (a), in steroid-deprived media (b), or for 48 h in complete media (c–k) in the presence of vehicle (control) or the indicated drugs. Nuclear TUNEL staining was analyzed by immunofluorescence, and the quantitation is expressed as percentage of TUNEL+ cells (a, b). Also, cells were lysed and the expressions of the proteins involved in apoptotic pathways were detected by Western blot (c). Densitometric analyses are presented as follows: Caspase 9 measured as percentage of active Caspase 9 (d) and pro-Caspase 9/β-actin ratio (e), Caspase 3 measured as percentage of active Caspase 3 (f) and pro-Caspase 3/β-actin ratio (g), PARP-1 measured as percentage of cleaved PARP-1 (h), BAX/β-tubulin ratio (i), Bcl-xL/β-tubulin ratio (j), and BAX/Bcl-xL ratio (k). Results are expressed as fold change of the control cells (vehicle-treated cells). a n = 2–3, in duplicates (ANOVA p = 0.0010; *p < 0.05; ***p < 0.001 vs. vehicle). b n = 4, in duplicates (ANOVA p = 0.0034; **p < 0.01 vs. vehicle; #p < 0.05 vs. vehicle + HET0016; +p < 0.05 vs. DHT 0.1 nM). d n = 3 (ANOVA p = 0.0139; *p < 0.05 vs. vehicle). e n = 3 (ANOVA p = 0.0006; ***p < 0.001 vs. vehicle). f n = 3 (ANOVA p = 0.0410; *p < 0.05 vs. vehicle). g n = 3 (ANOVA p = 0.0212; *p < 0.05 vs. vehicle). h n = 2 (ANOVA p = 0.0145; *p < 0.05 vs. vehicle). i n = 3 (ANOVA p = 0.1394). j n = 3 (ANOVA p = 0.0102; *p < 0.05 vs. vehicle). k n = 3 (ANOVA p = 0.0043; **p < 0.01 vs. vehicle). Values are presented as the mean ± SEM

