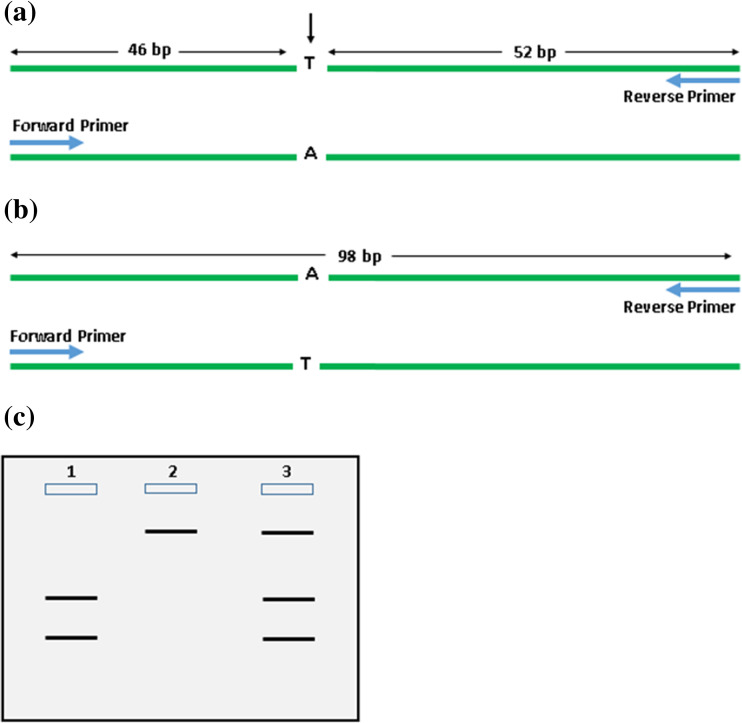
Fig. 4.
Schematic diagram showing PCR-RFLP analysis of the BRAFV600E mutation using the restriction enzyme TspR1. a BRAF exon 15 containing wild-type genotype is amplified by PCR primers and cleaved with TspR1 which gives two bands of lengths 46 and 52 bp. The arrow indicates cleavage by restriction enzyme. b BRAF exon 15 containing mutant genotype is amplified by PCR primers and cleaved with TspR1 which gives an intact band of length 98 bp. c Banding pattern visualized via polyacrylamide gel electrophoresis; lane 1 shows the banding pattern of a wild-type genotype; lane 2 shows the banding pattern of a mutant genotype; lane 3 shows the banding pattern of a heterogeneous malignant tumor consisting of both wild-type and mutant genotypes

