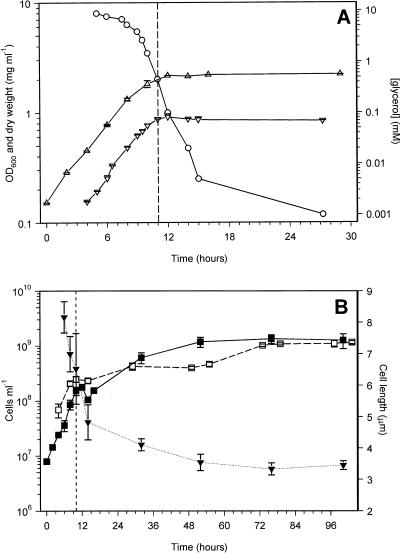
FIG. 2.
Growth of M. smegmatis and entry into carbon-limited stationary phase. (A) Changes in optical density (▵), biomass (dry weight, ▿), and glycerol concentration (○). (B) Changes in viable (■) and total (□) cell numbers and in cell length (▾). The glycerol concentration experiment was performed four times with similar results. OD600, biomass, and viable count results are means ± SE of results of duplicate experiments. Mean cell lengths ± SE are shown, with numbers of cells varying between 12 and 30. Total cell counts are means ± SE of determinations from between 8 and 10 hemocytometer fields of 2.5 × 10⁻⁴ mm3. The vertical dashed lines indicate the point of entry into stationary phase.

