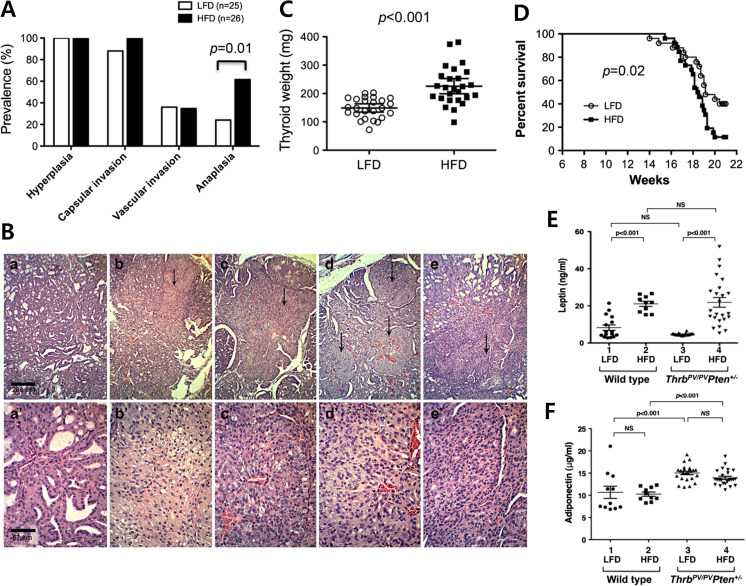
Fig. 2.
HFD-induced obesity induces aggressive phenotype in ThrbPV/PVPten+/− mice. a Pathological changes in thyroid cancer progression in high-fat diet (HFD) group and low-fat diet (LFD) group. There was significant increase in anaplastic transformation after HFD-induced obesity. b Anaplastic transformations in HFD-induced obese ThrbPV/PVPten+/− mice. H&E-stained thyroid tumor sections of LFD-treated ThrbPV/PVPten+/− mice are shown in panels a and a′at low magnification and high magnification, respectively. H&E-stained thyroid tumor sections of HFD-treated ThrbPV/PVPten+/− mice are shown in panels b, c, d, and e and in b′, c′, d′, and e′ at low and high magnification, respectively. Representative samples of anaplastic loci indicated by arrows are apparent at low magnification in panels b, c, d, and e (×20). The foci are selected shown at high magnification in the corresponding panels b′, c′, d′, and e′ (×80). c The weights of thyroid tumors in HFD group and LFD group, presented as mean ± SE. The difference was analyzed by Student’s t test. d The survival of ThrbPV/PVPten+/− mice was shorter in HFD group than LFD group. The Kaplan-Meier curves were compared by the log-rank test. e, f The serum leptin and adiponectin concentrations in wild-type and ThrbPV/PVPten+/− mice treated with LFD or HFD. [24]

