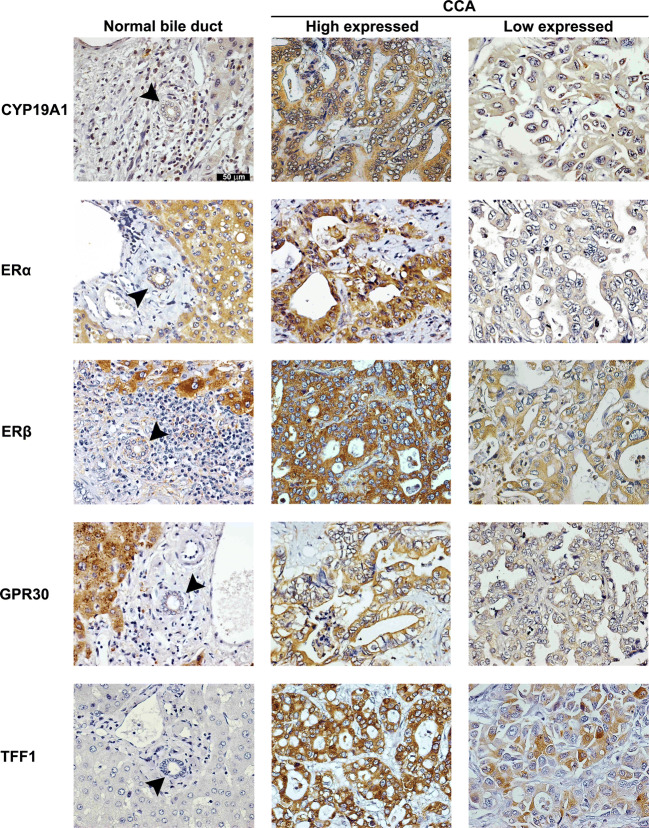
Fig. 1.
The expressions of CYP19A1, ERα, ERβ, GPR30, and TFF1 in normal bile duct of the tumor adjacent area and CCA tissues (n = 74; original magnification × 200). Arrow heads indicate normal bile ducts. Positive staining immunoreactivities were represented with brown color. Blue color represented the nucleus

