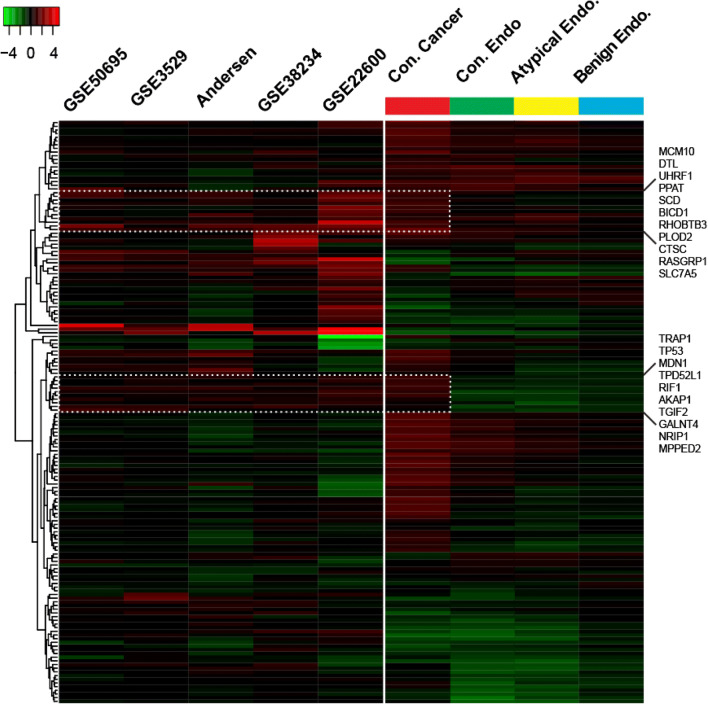
Fig. 3.
Gene expression of profiles of disease types compared to E2-regulated gene expression in breast, ovarian, and endometrial cell lines. Gene expression of the samples included in our study was compared to studies of gene expression following estrogen treatment in ERα-positive breast cancer cell lines (GSE50695, GSE3529), ovarian cancer cell lines (GSE22600), and endometrial cancer cell lines (GSE28234) found in GEO as well as one in-house study. Cell line studies are colored by fold change of estrogen treatment vs. vehicle control. Patient samples are colored as fold change vs. normal endometrium. The upper and lower panels in the figure below correspond to the highlighted gene lists to the right side of the figure.

