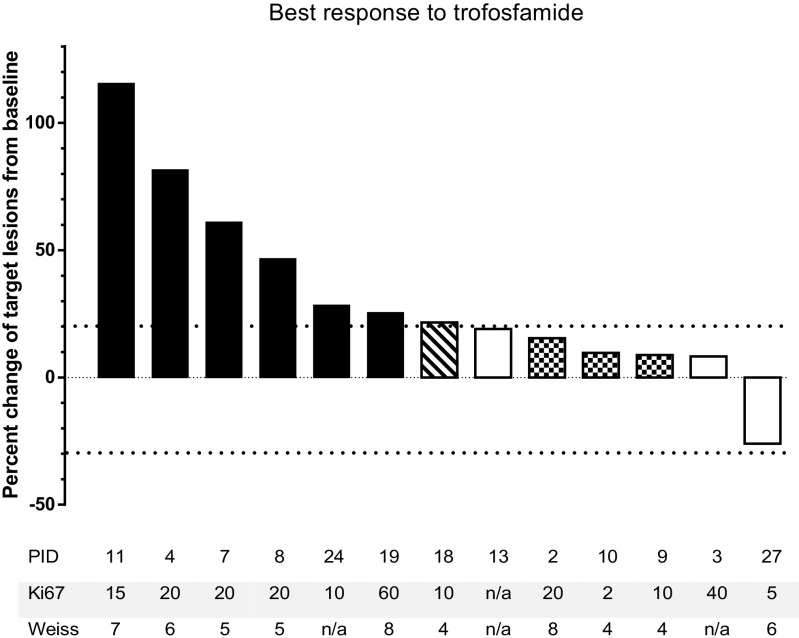
Fig. 2.
Waterfall plot of RECIST sum diameter at best response in patients with ACC treated with trofosfamide. Black bars: PD of target lesions, white bars: SD according to RECIST, squared bars: SD of target lesions, new tumor lesions, overall PD; dashed bar: new tumor lesions. Ki67: Ki 67 index (%), Weiss: Weiss score

