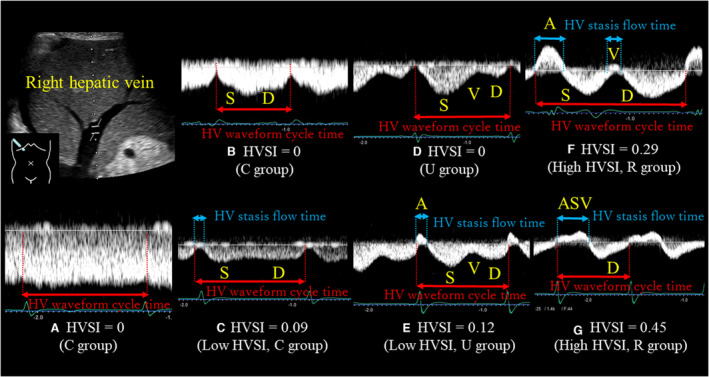
Figure 2. Abdominal ultrasonography.

All abdominal ultrasonography studies were performed in the right HV. HV waveforms were obtained using a pulsed‐wave Doppler device. The downward Doppler signal indicates the venous return flow (antegrade flow), the upward Doppler signal indicates the reversed blood flow to the liver from the heart (retrograde flow), and no signal indicates stasis flow. We defined the total of reversed blood flow time to the liver from the heart and stasis flow time as HV stasis flow time. We calculated HVSI, which indicates the proportion of the HV statis flow time to the HV waveform cycle time, as follows: HV stasis flow time/HV waveform cycle time. Patients with an HVSI of 0 were defined as the HVSI 0 group (HVSI=0). Patients with HVSI above 0 were divided into 2 groups based on the median value of HVSI (0.20): the low HVSI group (HVSI 0.01–0.20) and the high HVSI group (HVSI>0.20). Next, the maximal flow velocity (V), ventricular systolic (S), ventricular diastolic (D), and atrial reversal (A) waves were measured. We classified HV waveforms into 3 groups based on previous studies by the shape and position of the V wave: those in whom the continuous flow pattern or V wave was ambiguous (C group), those in whom the V wave ran under the baseline (U group), and those who had a reversed V wave (R group). HVSI increased with increasing severity of congestion. This figure shows representative HVSI and HV waveform groups in patients with HF. A, HVSI=0 with C group. B, HVSI=0 with C group. C, Low HVSI with C group. D, HVSI=0 with U group. E, Low HVSI with U group. F, High HVSI with R group. G, High HVSI with R group. HV indicates hepatic vein; and HVSI, hepatic venous stasis index.
