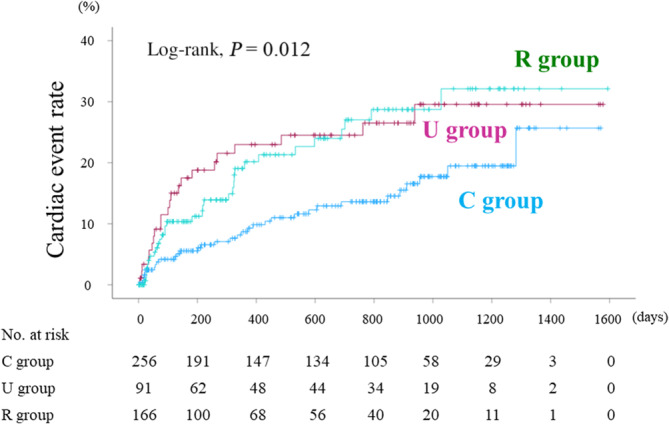
Figure 4. Kaplan–Meier analysis for cardiac event rate stratified by HV waveform groups.

The cumulative cardiac event rate was lowest in the C group among the groups (log‐rank, P=0.012). HV indicates hepatic vein.

The cumulative cardiac event rate was lowest in the C group among the groups (log‐rank, P=0.012). HV indicates hepatic vein.