
Figure 3. Comparison of the areas under the ROC curves generated for the independent predictors of the composite event.
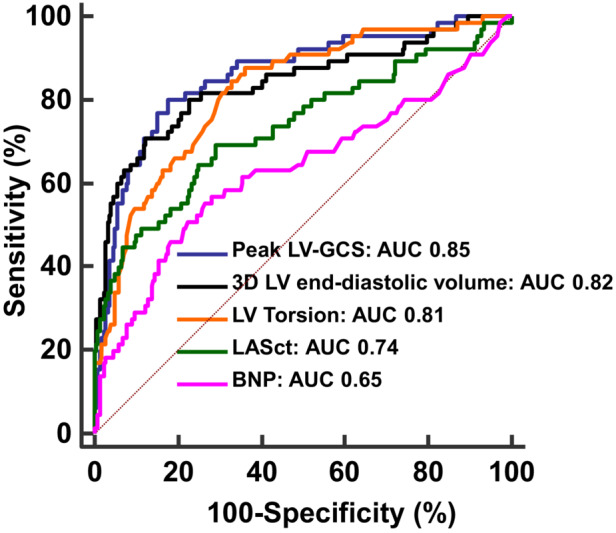
Comparison of ROC curves generated for LV‐GCS, 3DE LV end‐diastolic volume, LV torsion, LASct, and BNP. Peak LV‐GCS, 3DE LV end‐diastolic volume, and LV torsion presented a larger AUC than LASct (P=0.003, P=0.02, P=0.04, respectively), and BNP (P<0.0001, P<0.0001, P= 0.0002, respectively). Differences in areas under the ROC curves were assessed by pairwise comparison, as previously described. 45 3D indicates 3‐dimensional; 3DE, 3‐dimensional echocardiogram; AUC, area under the receiver operating characteristic curve; BNP, brain natriuretic peptide; GCS, global circumferential strain; LA, left atrial; LASct, peak negative global LA strain; LV, left ventricular; and ROC, receiver operating characteristic.