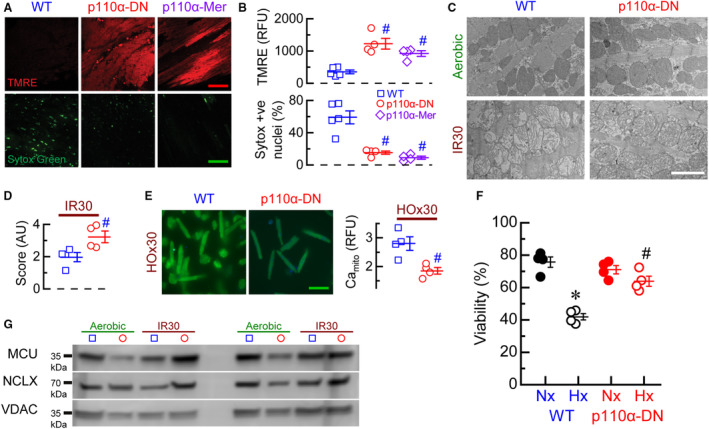
Figure 3. Mitochondrial function and structure in ischemia reperfusion.

A, Representative images of tetramethylrhodamine ethyl (TMRE, red) and sytox green stainings of in situ heart sections after 30‐minute ischemia and reperfusion for WT (wild‐type), p110α‐DN (constituent PI3Kα‐deficient), and p110α‐Mer (inducible PI3Kα‐deficient) hearts; calibration bars 50=μm. B, Quantification of in situ TMRE and sytox stainings of heart after 30‐minute ischemia and reperfusion for WT, p110α‐DN, and p110α‐Mer hearts. C, Representative images of transmission electron microscopy of sections of aerobically perfused WT, aerobically perfused p110α‐DN, 30‐minute ischemia–reperfusion (IR30) WT, and IR30 p110α‐DN hearts; calibration bar 2=μm. D, Quantification of mitochondria structure of transmission electron microscopy images of sections of aerobically perfused WT, aerobically perfused p110α‐DN, 30‐minute ischemia–reperfusion (IR30) WT, and IR30 p110α‐DN hearts (score: from 0 being “empty” [lacking any cristae] to 4 being normal healthy mitochondria). E, Left: representative images of mitochondrial Ca2+ staining for WT and p110α‐DN myocytes after 30 minutes hypoxia (HO×30); calibration bar 100=μm. Right: quantification of mitochondrial Ca2+ staining (Camito) for WT (blue) and p110α‐DN (red) myocytes after 30‐minute hypoxia. F, Cell viability for WT and p110α‐DN myocytes after 30‐minute normoxia (Nx) or 30‐minute hypoxia (Hx). G, Representative blots for mitochondrial calcium uniporter (MCU), mitochondrial Na+/Ca2+ exchanger (NCLX), and voltage‐dependent anion channel (VDAC) proteins from lysates of aerobically perfused WT, aerobically perfused p110α‐DN, 30‐minute ischemia–reperfusion (IR30) WT, and IR30 p110α‐DN hearts. Data are presented as mean±SEM; statistical significance is calculated using 1‐way ANOVA in (B and F); 2‐sided t test with Welsch correction in (D, E); # P<0.05 vs WT (B), # P<0.05 vs WT IR30 (D), # P<0.05 vs WT HO×30 (E), *P<0.05 vs WT Nx and # P<0.05 vs p110α‐DN Nx (F).
