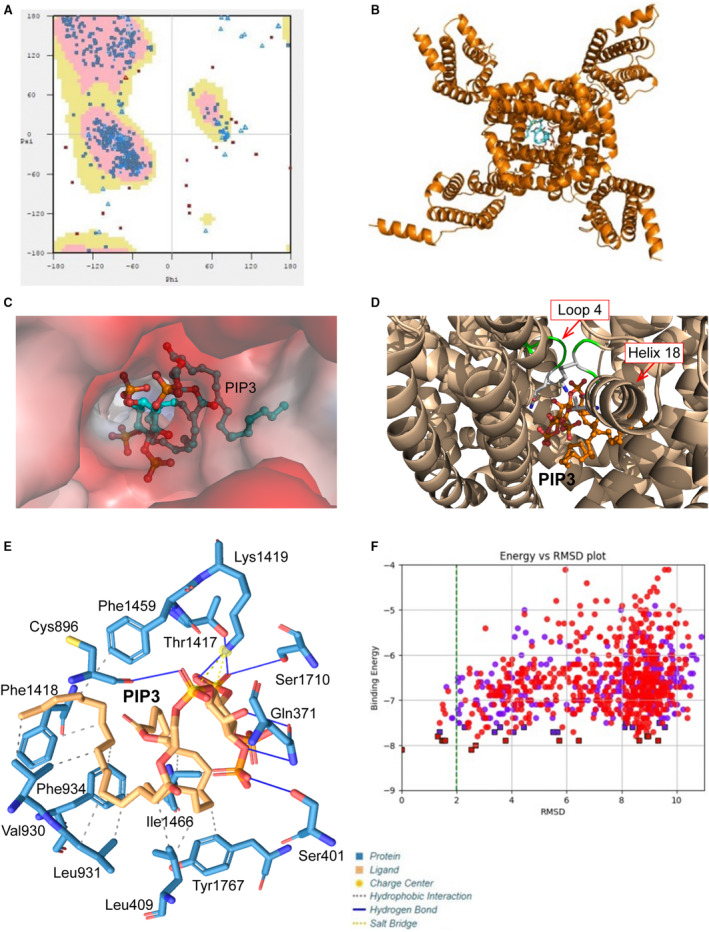
Figure 7. Modeling of the interaction of phosphatidylinositol‐3, 4, 5‐triphosphate (PIP3) with human NaV1.5.

A, Ramachandran plot of the distribution of residues between preferred regions (pink, 1089, 95.36%), allowed regions (yellow, 33, 2.89%), and outliers (20, 1.75%). B, Top (extracellular) view of NaV1.5 model with PIP3 inside the channel. C, Electrostatic potential surface of the cavity in the human NaV1.5 binding PIP3. D, Depiction of the region of the human NaV1.5 interacting with PIP3. E, Structure of PIP3 binding site of NaV1.5 channel. F, Plot of binding energy vs root‐mean‐square deviation (RMSD) for PIP3 and human NaV1.5 channel. Cys indicates cysteine; Gln, glutamine; Ile, isoleucine; Leu, leucine; Lys, lysine; Phe, phenylalanine; Ser, serine; Thr, threonine; Tyr, tyrosine; and Val, valine.
