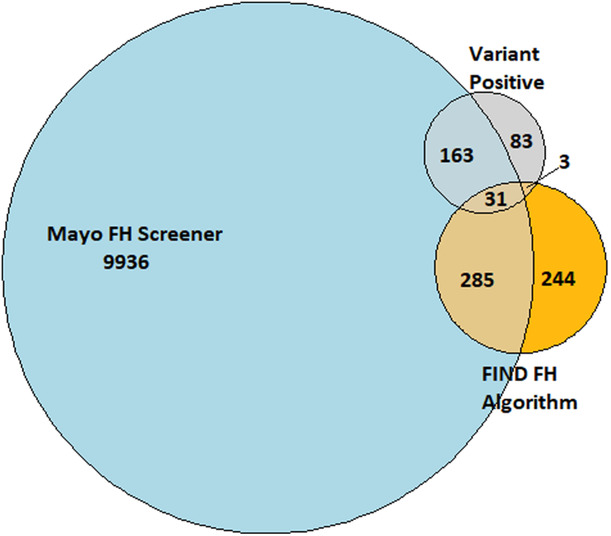
Figure 2. Venn diagram showing yield for an FH genetic variant of the FIND FH and Mayo algorithms.

The Venn diagram shows the overlap among those who were identified by Flag, Identify, Network, Deliver (FIND) FH (orange) and the Mayo algorithm (blue), and those who had a pathogenic or likely pathogenic familial hypercholesterolemia (FH) variant (gray).
