
Figure 2. Interindividual heterogeneity in cardiac structure before TAVI.
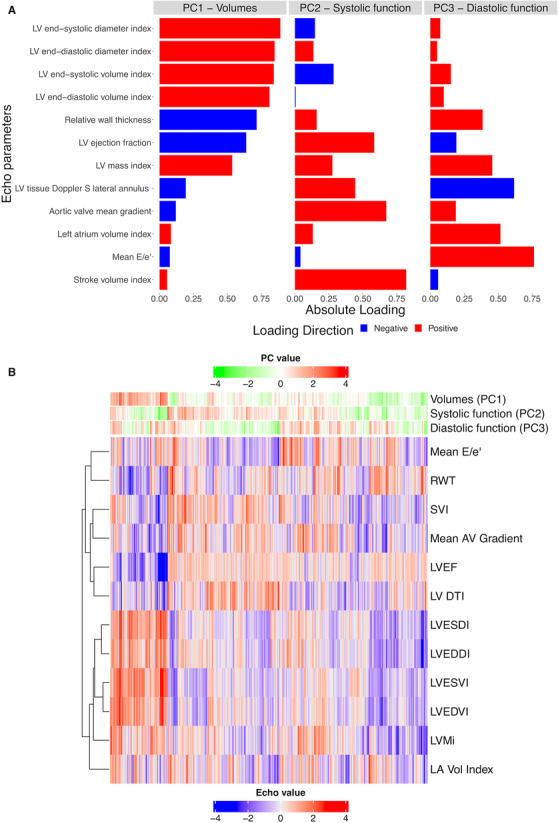
A, Results of PCA of 12 echocardiographic measures. The bar plot indicates the PCA‐based loadings for each echocardiographic measure for each PC. B, Clustered heatmap demonstrating individuals across echocardiographic measures, with PC scores for each individual represented as heatbars across the top of the heatmap. Each column is a participant, and rows represent phenotypes. AV indicates aortic valve; LA Vol, left atrium volume; LV DTI, tissue Doppler S velocity of lateral mitral annulus; LV, left ventricular; LVEDDI, left ventricular end‐diastolic diameter index; LVEDVI, left ventricular end‐diastolic volume index; LVEF, left ventricular ejection fraction; LVESDI, left ventricular end‐systolic diameter index; LVESVI, left ventricular end‐systolic volume index; LVMi, left ventricular mass index; PC, principal component; RWT, relative wall thickness; and SVI, stroke volume index.