Figure 1.

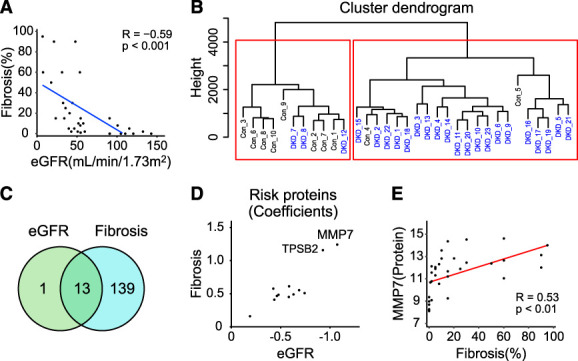
Unbiased proteomics analysis of human DKD kidney samples. (A) Scatterplot of eGFR (ml/min per 1.73 m2) and degree of interstitial fibrosis (Pearson R of −0.59). (B) Hierarchical clustering on the basis of proteomics data. (C) Venn diagram of proteins correlated with eGFR and interstitial fibrosis. (D) Scatterplot of correlation of coefficients between 12 proteins and eGFR and fibrosis. (E) Scatterplots of Matrix Metalloproteinase 7 (MMP7) expression measured by SOMAmer array (x axis) and degree of interstitial fibrosis (y axis) (Pearson R of 0.53). Figure 1 can be viewed in color online at www.jasn.org.
