
Figure 3.
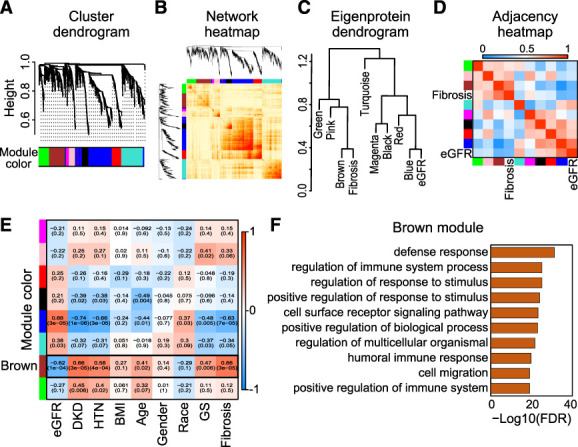
WGCNA of human DKD kidney samples. (A) Hierarchical clustering dendrogram of the proteins. (B) Heatmap representing the topological overlap matrix among all proteins in the analysis. (C) Dendrogram of eight module eigenproteins and two clinical traits (eGFR and interstitial fibrosis). (D) Eigenprotein adjacency heatmap with eGFR and interstitial fibrosis (see Methods section). (E) Correlation of module eigenproteins with clinical characteristics. Each row corresponds to a module eigenprotein, and the columns are clinical traits. The values in the cells are presented as “Pearson R (P value)” and color-coded by direction and degree of the correlation (red=positive correlation; blue=negative correlation). (F) Gene ontology pathway analysis of the top pathways enriched in the protein sets of the WGCNA brown module. Con, control; GS, glomerular sclerosis; HTN, hypertension. Figure 3 can be viewed in color online at www.jasn.org.