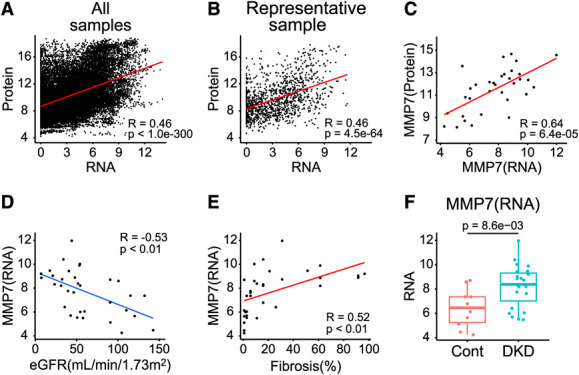
Figure 4.

Bulk RNA-seq displayed modest correlation with proteomics. (A) Correlation between kidney bulk RNA-seq and proteomics using all samples. (B) Correlation between bulk RNA-seq and proteomics using a representative sample. (C) Correlation of MMP7 expression between RNA and protein, with Pearson R of 0.64. (D) Correlation between MMP7 expression examined by bulk RNA-seq and eGFR, with Pearson R of −0.53. (E) Correlation between MMP7 expression examined by bulk RNA-seq and interstitial fibrosis, with Pearson R of 0.52. (F) Box plots showing MMP7 expression examined by bulk RNA-seq in DKD and control subjects. P values were calculated with the Wilcoxon rank-sum test (for two group comparison). Figure 4 can be viewed in color online at www.jasn.org.
