Figure 5.

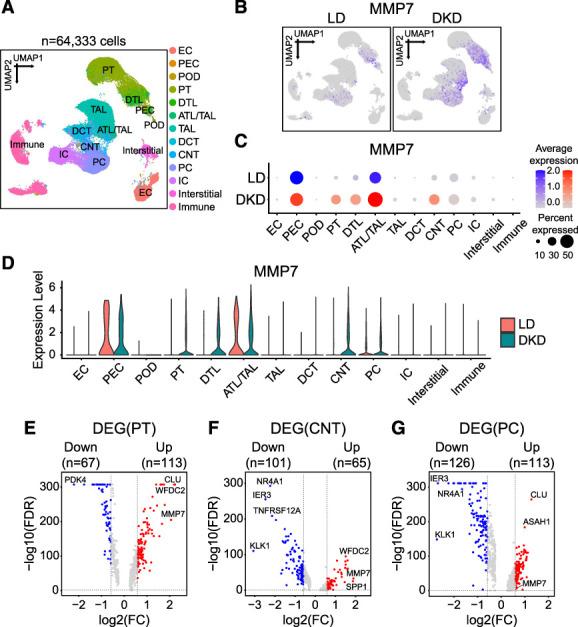
Cellular expression of MMP7 in human kidney single-cell RNA-seq. (A) UMAP showing 13 cell clusters (see Methods section). Assigned cell types are summarized in the Supplemental Spreadsheet 6. (B) Feature plots showing the expression of MMP7 in DKD subjects and LD. (C) Bubble plots showing MMP7 expression across 13 clusters between DKD subjects and LD. The size of the circle indicates the percent of positive cells, and the color indicates the level of expression. (D) Violin plots showing the MMP7 expression across 13 clusters between DKD subjects and LD. (E–G) Volcano plots of DEGs between DKD and LD in PT (E), CNT (F), and PC (G) clusters identified in the single-cell data. The x axis is log2-FC, and y axis is the statistical significance FDR=−log10. FDR <0.05 and |log2FC|>0.58 (=FC of 1.5) were considered criteria for DEG selection. Genes above the horizontal dotted gray line had FDR <0.05. DEG, differentially expressed gene; FC, fold change. Figure 5 can be viewed in color online at www.jasn.org.
