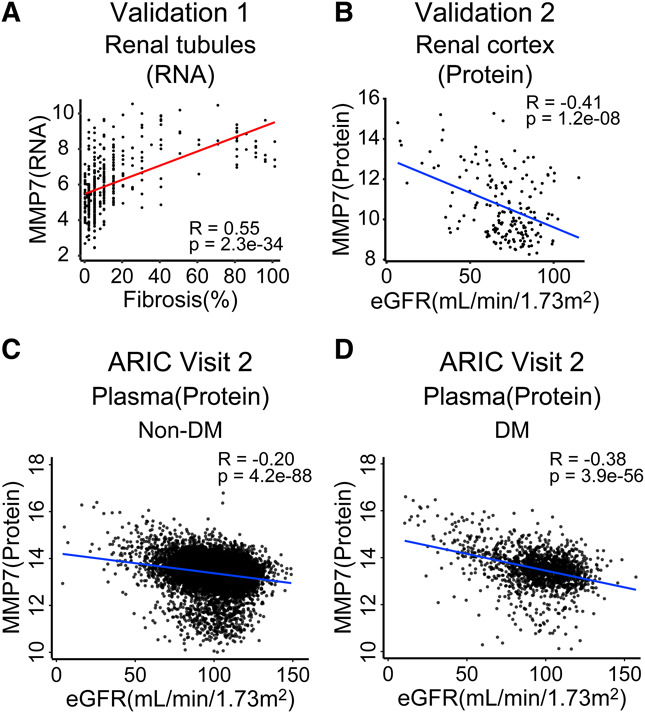
Figure 6.

Validation of the association of MMP7 with eGFR and interstitial fibrosis in other human kidney datasets. (A) Scatterplots of the MMP7 transcript level and the degree of fibrosis in 433 microdissected human kidney tubules (validation dataset 1). (B) Scatterplots of MMP7 protein expression and eGFR (ml/min per 1.73 m2) in 186 human DKD and control kidneys (validation dataset 2). (C) Scatterplot of plasma MMP7 protein levels and eGFR (ml/min per 1.73 m2) in nondiabetic participants of ARIC (validation dataset 3). (D) Scatterplot of plasma MMP7 protein levels and eGFR (ml/min per 1.73 m2) in diabetic participants of ARIC (validation dataset 3). Figure 6 can be viewed in color online at www.jasn.org.
