Figure 3.
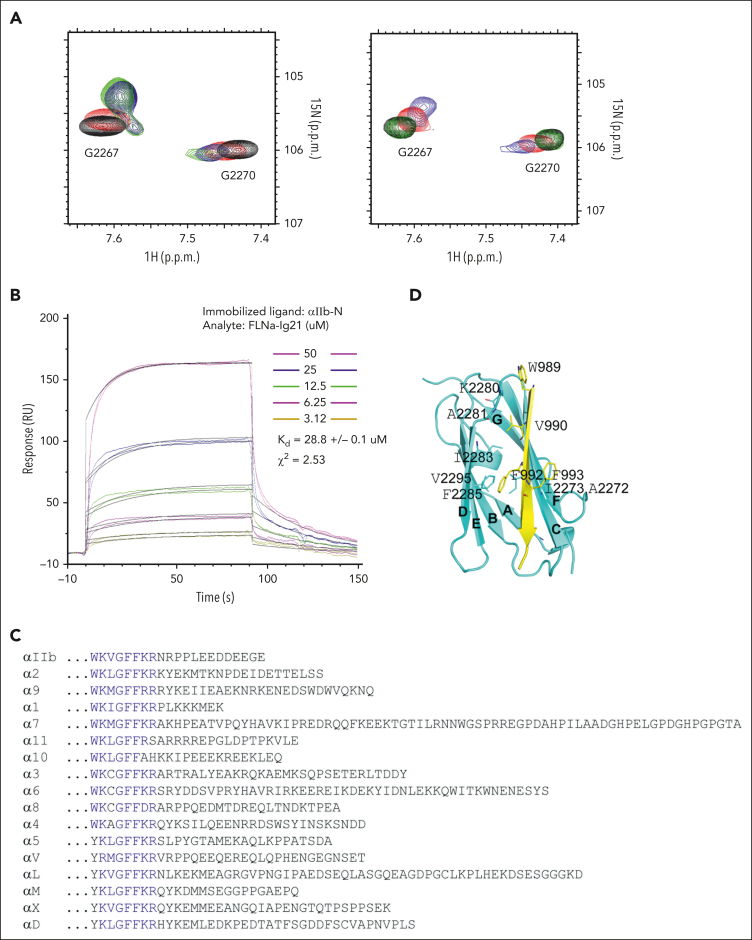
FLNa-Ig21 strongly binds to activated integrin αIIb CT that displays an open conformation. (A) (left) Selected region of HSQC of 0.1 mM 15N-labeled FLNa-Ig21 in the absence (black) and presence (red) of 0.2 mM αIIb CT, (blue) 0.2 mM αIIb-N, or (green) 0.2 mM αIIb CT DDE to KKK mutant; (right) selected region of HSQC of 0.1 mM 15N-labeled FLNa-Ig21 in 0% PIP2 vesicle (black), 0% PIP2 with 0.2 mM αIIb CT (red), 20% PIP2 to mimic locally enriched PIP2 (green), or 20% PIP2 with 0.2 mM αIIb CT (blue). (B) Representative real-time surface plasmon resonance sensorgrams of the binding between αIIb-N and FLNa-Ig21 (n = 2). The real-time binding curves (colored) were fitted (gray fitting curves) using a global fitting algorithm for a 1:1 binding model, resulting in the KD ∼28 uM. (C) Sequence alignment of α CTs of human integrins. Highly conserved residues are in blue. (D) The X-ray crystal structure of FLNa-Ig21-αIIb CT chimeric protein. β-strands are labeled from A to G based on the canonical immunoglobulin topology. FLNa-Ig21 is colored in cyan, and αIIb CT, in yellow, showing that αIIb CT N–terminus adopts the β-strand to bind the CD groove of FLNa-Ig21. Interface side chains are displayed and labeled.

