Figure 3.
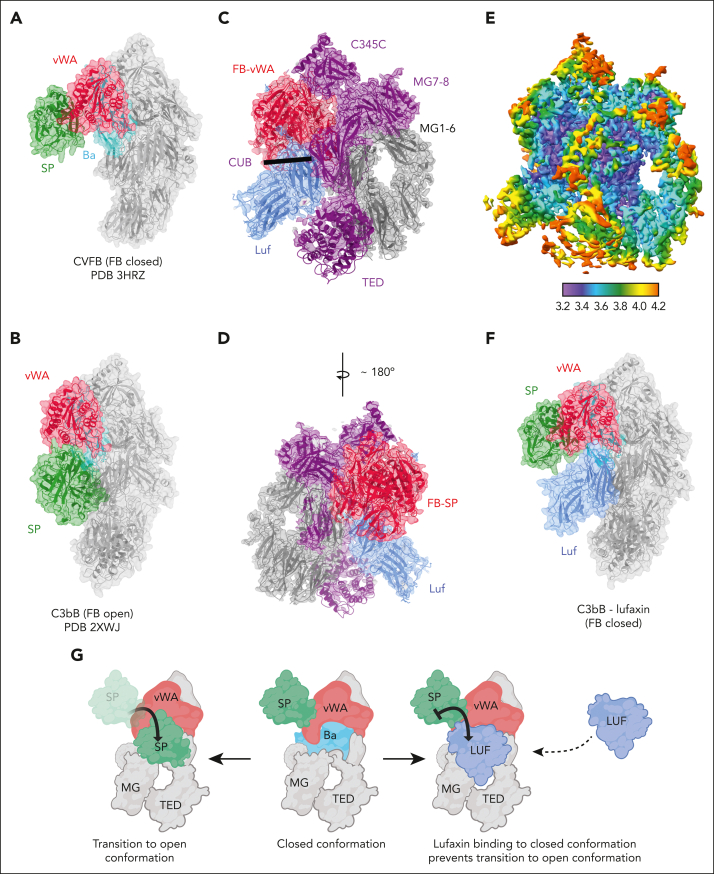
Structure of the C3bB-lufaxin complex. (A,B) Semitransparent surfaces covering ribbon diagrams of previously determined structures of CVFB (A) (Protein Database [PDB] accession number 3HRZ37) and C3bB in the presence of Ni2+ (B) (PDB accession number 2XWJ30). Regions of the C3bB surface and ribbon diagram are colored as follows: C3b and CVF, light gray; FB VWA domain, red; FB SP domain, green; FB Ba fragment, cyan. (C,D) Two views of the C3bB-lufaxin 3D reconstruction related by ∼180° rotation around the vertical axis and covering a ribbon diagram of the refined C3bB-lufaxin model. Coloring: C3b α-chain, purple; C3b β-chain, light gray; FB, red; lufaxin (Luf), light blue. Domain landmarks are labeled on the figures. (E) Three-dimensional reconstruction of C3bB-lufaxin colored by local resolution (as calculated using Phenix) and oriented as in panel C. Resolution color scale is shown in the bar below panel. (F) Model of C3bB-lufaxin in surface representation and oriented as CVFB in panel A and C3bB in panel B. Comparison of the 3 shows C3bB-lufaxin having the closed conformation of FB and lufaxin occupying the position of the SP domain in the C3bB-Ni2+ structure. (G) Schematic representation of conformational changes occurring in C3bB during the activation of FB and the inhibition of these changes by bound lufaxin. Panel created with Biorender.com.

