Figure 5.
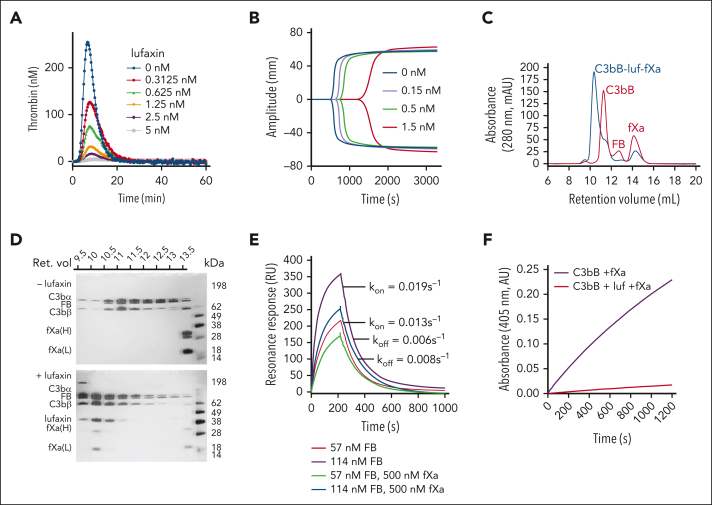
Binding and inhibition of fXa by lufaxin. (A) Concentration dependence of lufaxin inhibition of thrombin generation in whole plasma using the thrombinoscope. Legend shows lufaxin concentrations. (B) Inhibition of clot formation by lufaxin as measured via thromboelastography. Legend shows lufaxin concentrations. (C) Size exclusion chromatography (A280) of C3bB-fXa mixtures in the presence (blue trace) and absence (red trace) of lufaxin (luf). The elution buffer was 10 mM 4-(2-hydroxyethyl)-1-piperazineethanesulfonic, pH 7.4, and 0.15 M NaCl (HBS) containing 5 mM MgCl2; the identified peaks are labeled. (D) Sodium dodecyl sulfate-polyacrylamide gel electrophoresis of fractions from the chromatograms in panel C with silver staining. (Top) A sample separated in the absence of lufaxin and (bottom) a sample separated in the presence of lufaxin. The retention volume scale above the gels corresponds to the x-axis of the chromatograms. The bands are labeled on the left side of the gel, and the standard sizes are shown on the right side. (E) SPR analysis of complex formation on a C3b surface in the presence and absence of fXa. Injections of 57 or 114 nM FB along with 500 nM lufaxin were made in the presence or absence of 500 nM fXa. The rate constants kon and koff refer to the observed first-order rate constants for association and dissociation of the complex at 114 nM FB, 500 nM lufaxin in the absence of fXa (purple trace) and 114 nM FB, and 500 nM lufaxin in the presence of fXa (blue trace). The buffer for all experiments was HBS containing 5 mM Mg2+. (F) Progress curves for the hydrolysis of S2222 (250 μM) using 4.3 nM fXa in the presence of 176 nM each of C3b and FB either with (red trace) or without (purple trace) 30 nM lufaxin. The experiment was performed in HBS containing 5 mM MgCl2 at 30°C.

