Figure 5.
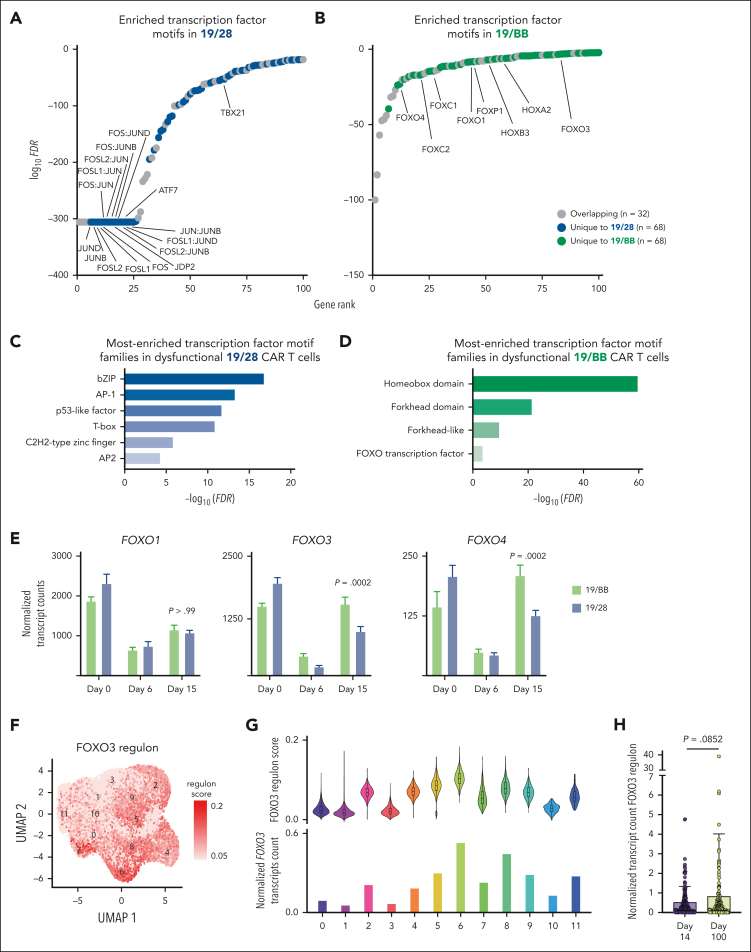
TBBD cells demonstrate reactivation of FOXO3. (A-B) Transcription factor motif analysis demonstrates increased accessibility of (A) AP1 sites in 19/28 cells and (B) HOX and FOX sites in 19/BB cells as cells progress from resting to dysfunctional. (C-D) Pathway enrichment analysis of unique sites with increased accessibility in (C) 19/28 cells and (D) 19/BB cells. (E) Expression of FOXO1, FOXO3, and FOXO4 transcripts over time. Significance determined using two-way ANOVA. (F) Expression of the FOXO3 regulon in 19/28 and 19/BB cells collected on days 0, 6, and 15. (G) FOXO3 regulon score for each scRNAseq cluster (top) and normalized FOXO3 transcript count for each cluster (bottom). (H) Expression of FOXO3 regulon in day-14 and day-100 cells collected from patient peripheral blood. Significance determined using Mann-Whitney test.

