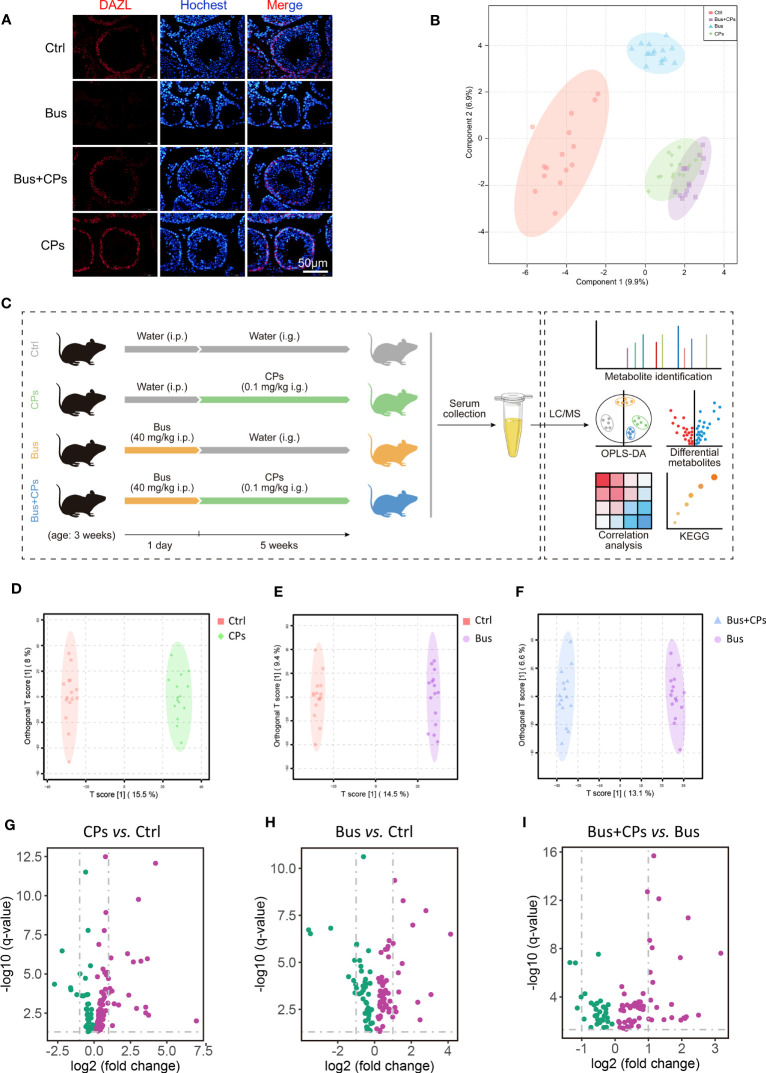
Figure 1.
Study design and CPs-produced changes in metabolic features. (A) Histopathology photos of DAZL staining of mice testes; (B) the beta diversity analysis between the different groups by Principal Coordinates Analysis (PCoA); (C) the whole design of the study; (D-F). the Orthogonal Partial least squares discriminant analysis (OPLS-DA) of diverse groups; (G-I). the volcano map of differential expressed metabolites from different comparison groups.

