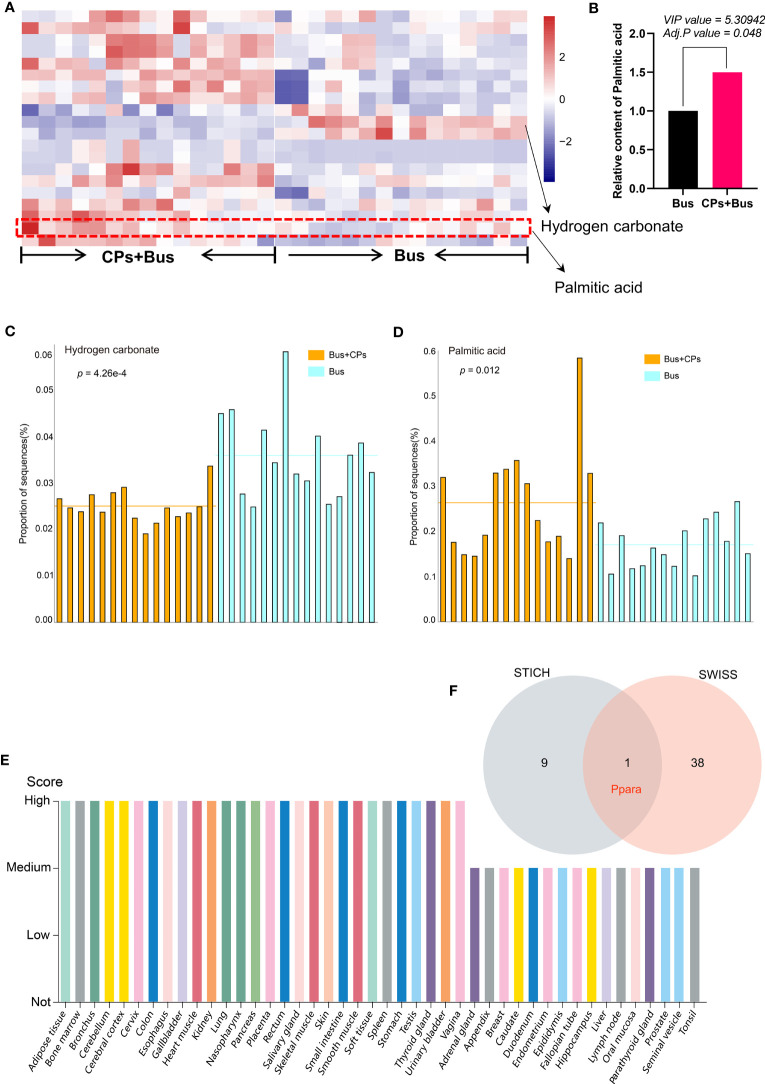
Figure 3.
The expression display of key differential metabolites and screening of candidate target gene. (A) the heat map presentation of partial differential metabolites of the different groups in each sample; (B) the quantitative analysis of the palmitic acid from different groups; (C, D). the STAMP analysis of Hydrogen carbonate and palmitic acid difference between groups; (E) the expression profiling of PPARA gene from The Human Protein Atlas; (F) the prediction and screening of target gene using different tools.

