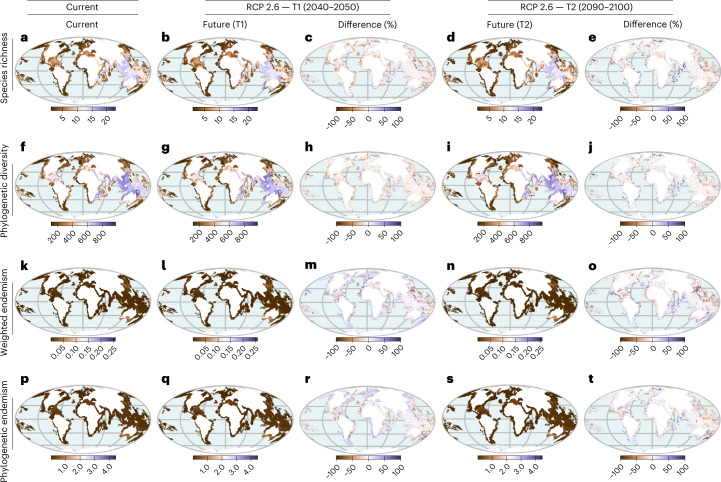
Fig. 2. Temporal and geographic patterns of change in α-diversity of seagrasses under climate change.
Estimates are based on species distribution models of seagrasses (n = 66 species) fitted using maximum entropy and aggregated to 100 × 100 km2 grid cells. Indicated are the spatial and temporal distributions of: a–e, species richness (number of species in a grid cell) for (a) current, (b) future, and (c) difference for mid-century (2050) and (d) future, and (e) difference forend-of-century (2100); f–j, phylogenetic diversity (sum phylogenetic branch lengths connecting species in a grid cell) for (f) current, (g) future, and (h) difference for mid-century (2050) and (i) future, and (j) difference for end-of-century (2100); and k–o, weighted endemism (species richness inversely weighted by species ranges) for (k) current, (l) future, and (m) difference for mid-century (2050) and (n) future, and (o) difference for end-of-century (2100); p–t, phylogenetic endemism (the amount ofevolutionary history that is unique to a particular areas) for (p) current, (q) future, and (r) difference for mid-century (2050) and (s) future, and (t) difference for end-of-century (2100). Differences in α-diversity for each metric are shown for T1 (2040–2050) and T2 (2090–2100) both under RCP 2.6 (best-case scenario). For each difference map (T1 (c,h,m,r) and T2 (e,j,o,t)), negative values indicate reductions in diversity and positive values correspond to increases in total diversity. Analyses of phylogenetic diversity and phylogenetic endemism were based on a randomly selected subset of 100 trees from a random distribution of 1,000 trees. Projected shifts in α-diversity under different climate scenarios are presented in Extended Data Figs. 1–4. The maps are in the Mollweide projection.

