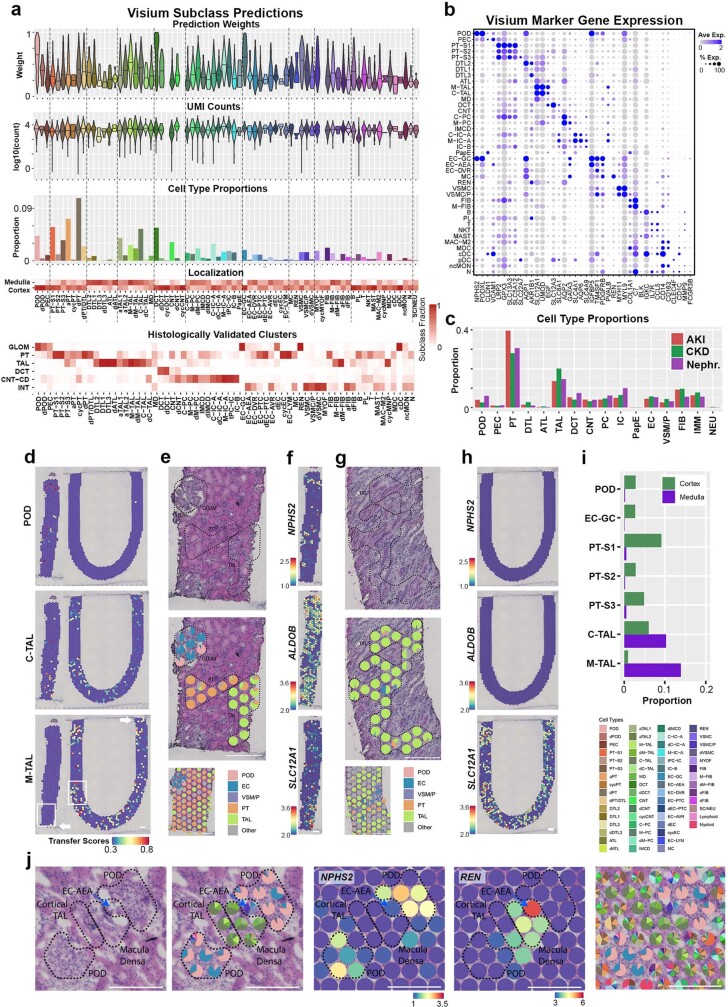
Extended Data Fig. 5. 10X Visium predicted cell types.
a. Analysis of subclass (level 2) predictions on 10x Visium spots (23 samples, 22 individuals). The top panel presents the distribution of transfer scores for the subclass (level 2) with the highest score in each spot. The UMI count panel presents the UMI counts associated with these spots. The cell type proportion panel depicts the proportion of transcriptomic signatures for each subclass, corresponding to its transfer score relative to all non-zero transfer scores in that spot. The relative proportion of cell type subclass signatures arising from the cortex or medulla in the 23 samples is shown. The bottom panel reveals the alignment between the predicted cell type subclass and unsupervised clusters that were histologically validated (Methods). b. Dot plot showing gene expression of select cell markers by predicted subclass (level 2) for all 23 Visium samples. c. The proportion of transcriptomic signatures in the 23 samples revealed a similar distribution of cell types across healthy reference nephrectomies, chronic kidney disease (CKD), and acute kidney injury (AKI) samples. d. Cortical (left, I) and medullary (right, U) portions of specimen 21-0063 reveal POD signatures confined to the cortex, while M-TAL signatures were found in the medulla. White arrows denote the connection point between the cortex and medulla portions of the sample. e. A histologic image of the cortex (bounded in d) reveals level 1 cell type mapping of POD, EC-GC, and VSM/P cells to a glomerulus. PT and TAL signatures were seen mapped over distinct regions of tubules. f. Expression of NPHS2 (for glomeruli), ALDOB (for PT), and SLC12A1 (for TAL) in the cortex. g. A histologic image of the medulla (bounded in d) reveals level 1 cell type mapping of a high proportion of TAL cells within the medulla. h. Feature plots showing SLC12A1 but not NPHS2 or ALDOB expression in the medulla. i. Proportion of cortex and medulla cell types for sample 21-0063 (9555 total spots over two sections of the same individual). j. A cortical image in a healthy reference sample (19-M61) showing EC-AEA entering the glomerular corpuscle near the MD. Two glomeruli contain signatures arising predominantly from POD and EC-GC. Two TAL niches are outlined. TAL niche 1 is enriched in healthy cortical TAL signature and TAL niche 8 near the afferent arteriole is enriched for Macula Densa (MD) signature. NPHS2 expression is found within the glomeruli and renin (REN) expression is highest in the EC-AEA. A full level 2 cell type deconvolution is provided in the final panel (right). Scale bars are 300 μm in length.

