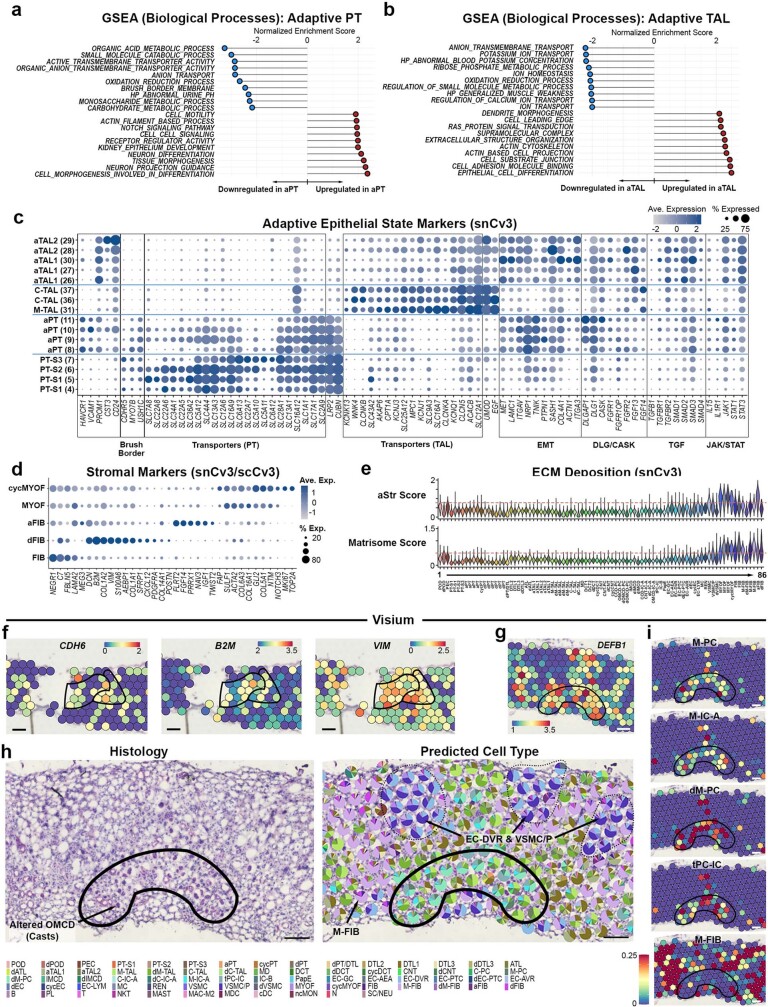
Extended Data Fig. 7. Altered state expression signatures.
a-b. Gene Set Enrichment Analyses (GSEA) for genes upregulated or downregulated in adaptive PT (a) and TAL (b) states compared to reference states. c. Dot plot showing averaged marker gene expression values (log scale) and proportion expressed for snCv3 clusters. d. Dot plot showing averaged marker gene expression values (log scale) and proportion expressed for integrated snCv3/scCv3 reference, degenerative and adaptive stromal clusters. e. Violin plots showing aSTR and ECM (matrisome) scores for snCv3 clusters. f. Visium feature plots of normalized counts for select markers mapped to regions shown in Fig. 3e. Scale bar is 100 µm. g. Visium feature plot of normalized counts for a select marker mapped to region shown in (h). Scale bar is 100 µm. h. Histology and predicted cell types for a medullary region of acute tubular necrosis (cellular cast formation within tubular lumens, loss of brush border, loss of nuclei, and epithelial simplification). Pie charts are proportions of predicted transfer scores. Area corresponds to the upper bounded region in Fig. 3b. Scale bar is 100 µm. i. Predicted transfer scores for area shown in (h). Scale bar is 100 µm.

