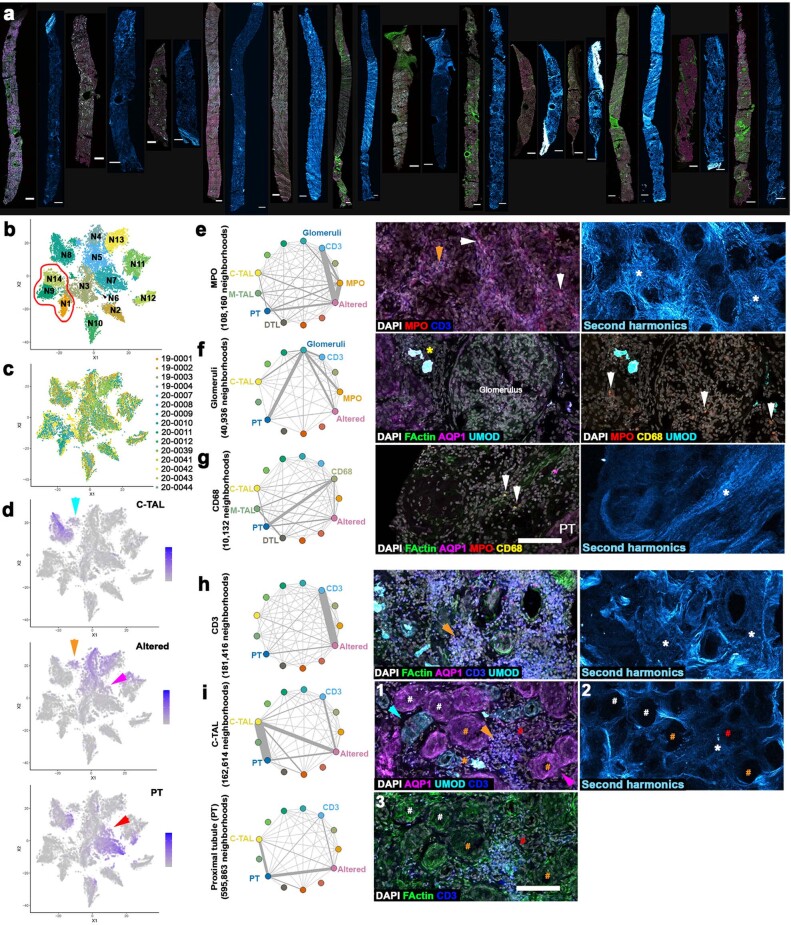
Extended Data Fig. 8. 3D imaging identifies injury neighbourhoods.
a. Maximum intensity projections of immunofluorescence and second harmonic images for 13 example biopsies, scale bars 500 µm. b. Overview of neighbourhood classes as given in Fig. 4b for reference. c. Distribution of neighbourhoods by specimen in neighbourhood clusters plotted in tSNE space from Fig. 4. d. Feature plots of the number of cells per neighbourhood for cortical TAL (C-TAL), altered morphology and proximal tubule (PT). C-TALs and PTs are found in neighbourhoods with altered morphology, cyan and orange vs. red and magenta arrowheads. e-h. Neighbourhoods with at least one cell for the labels indicated were subsetted and neighbourhood graphs generated to indicate the pairwise interaction between cell labels. At right: maximum Z-projections of 3D confocal fluorescence images with white arrow indicating MPO+ cells (e and f) or CD68+ cells (g), orange arrows indicating CD3+ cells and asterisks highlighting fibrosis (white) or areas of altered morphology/injury (yellow). Scale bar = 100 μm. h and i, pairwise subset analysis of CD3+, PT and TAL (orange, magenta and cyan arrows respectively). CD3+ cells cluster in regions of fibrosis (orange arrowhead and white asterisks). UMOD positive casts associate with regions of injury and CD3+ cells (orange asterisk), the tubular epithelium is intact with brush borders (white #), has evidence of epithelial simplification (orange #) or less AQP1 marker and epithelial simplification (red #). Scale bar = 100 µm.

