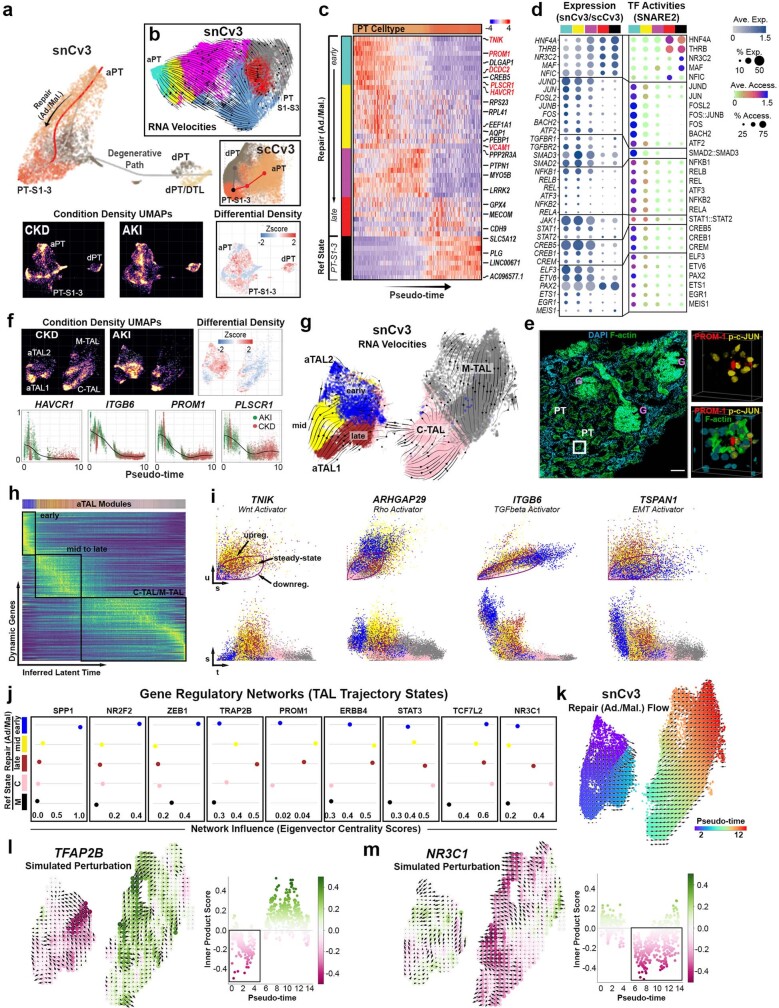
Extended Data Fig. 9. PT and TAL repair trajectories.
a. Trajectory of PT cells for snCv3 and scCv3 datasets. Bottom UMAPs are coloured by cell density for each condition (AKI/CKD), including the cell density difference between AKI and CKD. b. UMAP of PT subclasses (PT-S1-S3, aPT) with projected RNA velocities, derived from a dynamical model of PT repair modules, visualized as streamlines (Methods). c. Heatmap of smoothed gene expression profiles along the inferred pseudo-time for PT cells. Colour blocks on the left show different repair states or modules identified based on the gene expression profiles. d. Right panel: dot plot of SNARE2 average accessibilities (chromVAR) and proportion accessible for TFBSs showing differential activity in aPT modules. Left panel: dot plot of averaged gene expression values (log scale) and proportion expressed for integrated snCv3/scCv3 modules. e. 3D confocal imaging of a reference kidney tissue section stained for PROM-1 (red), Phopho-c-Jun (p-c-JUN, yellow), F-actin (with FITC phalloidin, green) and DNA with DAPI (cyan) (scale bar 100 µm). Regions of PROM-1 within a glomerulus (G) and a proximal tubule (PT) are indicated and enlarged in the right panels (rendered 3D volumes, scale bar 10 μm). This area shows the association of PROM-1 expression with p-c-Jun+ cells in the tubules. 3D rendering was performed using the Voxx software from the Indiana Center for Biological Microscopy (voxx.sitehost.iu.edu/). f. Top panels: TAL UMAPs as in Fig. 5a (snCv3) showing condition densities as in (a). Bottom panels: changes of smoothed gene expression (snCv3) for representative genes as a function of inferred pseudotime coloured by disease conditions. g. TAL UMAP as in Fig. 5a (snCv3) with projected RNA velocities, derived from a dynamical model for TAL repair modules, visualized as streamlines (Methods). h. Heatmap showing expression value dynamics (snCv3) along latent time inferred from RNA velocities for the top 300 likelihood-ranked genes. Top colour bar indicates aTAL repair modules. i. Scatter plots (u, unspliced; s, spliced; t, latent time) for putative driver genes (snCv3) identified by high likelihoods in the dynamical model. j. Gene regulatory networks associated with TAL repair modules (Methods, see Supplementary Table 23). Eigenvector centrality scores were plotted for select factors with high influence on different states. k. UMAP embedding (snCv3) showing pseudotime gradient and the derived vector field associated with TAL repair. l-m. UMAP embedding showing simulated vector fields following TFAP2B (l) or NR3C1 (m) perturbation. Barplots show inner product calculations (perturbation scores) comparing directionality and size of TAL repair flow vectors and the simulated perturbation vectors. Negative perturbation scores indicate a block in differentiation.

